InetSoft's Updated COVID-19 Dashboard Shows State, Province, and County Hotspots
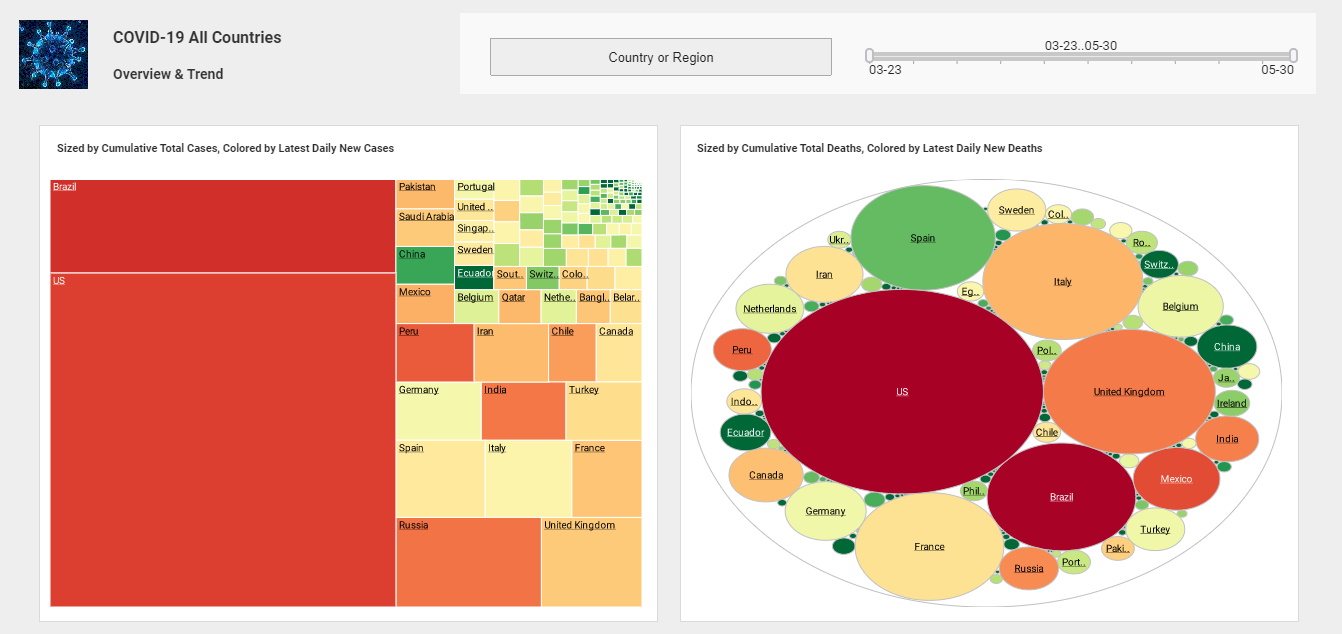
July 6, 2020 - Piscataway NJ, InetSoft Technology, a pioneer in data intelligence, analytics, and dashboarding, has updated its live COVID-19 tracking dashboard to easily reveal hotspots around the world, down to the state or province for most countries and the county level for the US.
With advanced data visualization methods and added analytic metrics for recency, viewers can more quickly identify locations of increases and monitor improvements. The interactive analytical dashboard mashes up live data from Johns Hopkins University, covidtracking.com. Features of the data visualization include:
- State or province level new cases and deaths for most countries
- County level new cases and deaths
- Statewide hospitalization rates for the US
- Testing and positivity rates by state for the US
- 15 charts in total, all expandable with detail data downloadable
"Everyone is looking forward to reopening economies, so in this stage of the battle against COVID-19, the focus is on how regions are doing in their varying stages of reopening. With this update to our popular tracking dashboard, we believe we are mashing up the most data possible and applying advanced analytic techniques to help individuals and institutions better track positive and negative developments," offered Mark Flaherty, Chief Marketing Officer at InetSoft.
To interact with the live novel coronavirus tracking dashboard, please visit:
https://www.inetsoft.com/info/us_covid_test_tracker_dashboard/
About InetSoft
Since 1996, InetSoft has been delivering easy, agile, and robust business intelligence software that makes it possible for organizations and solution providers of all sizes to deploy or embed full-featured business intelligence solutions. Application highlights include visually-compelling and interactive dashboards that ensure greater end-user adoption, plus pixel-perfect report generation, scheduling, and bursting. InetSoft's patent pending Data Block technology enables productive reuse of queries and a unique capability for end-user defined data mashup. This capability, combined with efficient information access enabled by InetSoft's visual analysis technologies, allows a maximum degree of self-service that benefits the average business user, the IT administrator, and the developer. InetSoft solutions have been deployed at over 5,000 organizations worldwide, including 25% of Fortune 500 companies, spanning all types of industries.
Contact
For more information, media and analysts may contact:
Mark Flaherty
InetSoft Technology Corp.
+1.732.424.0400 x 936
mark.flaherty@inetsoft.com
www.inetsoft.com
Quotable
“The focus is on how regions are doing in their varying stages of reopening...”
Visualization Views

![]()