Style Scope Software Gives Non-technical Business Professionals a Powerful, Easy-to-Use Visual Tool for Real-time Data Exploration and What-if Analysis
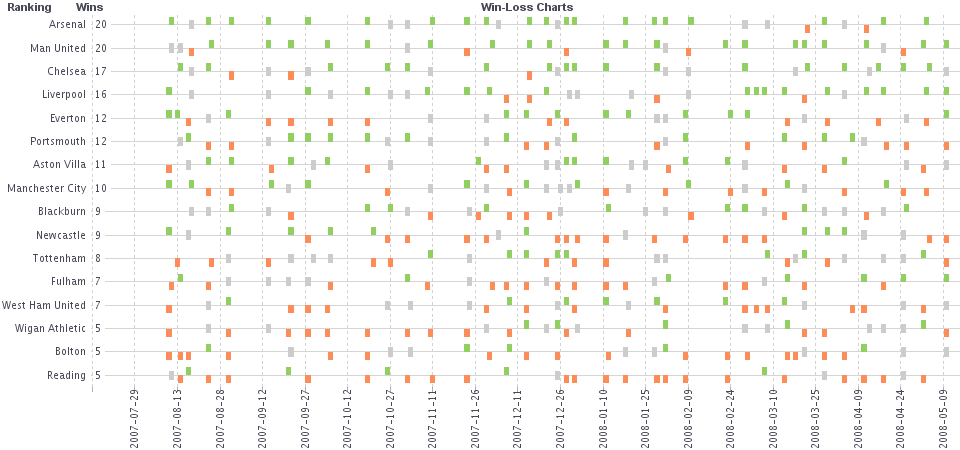
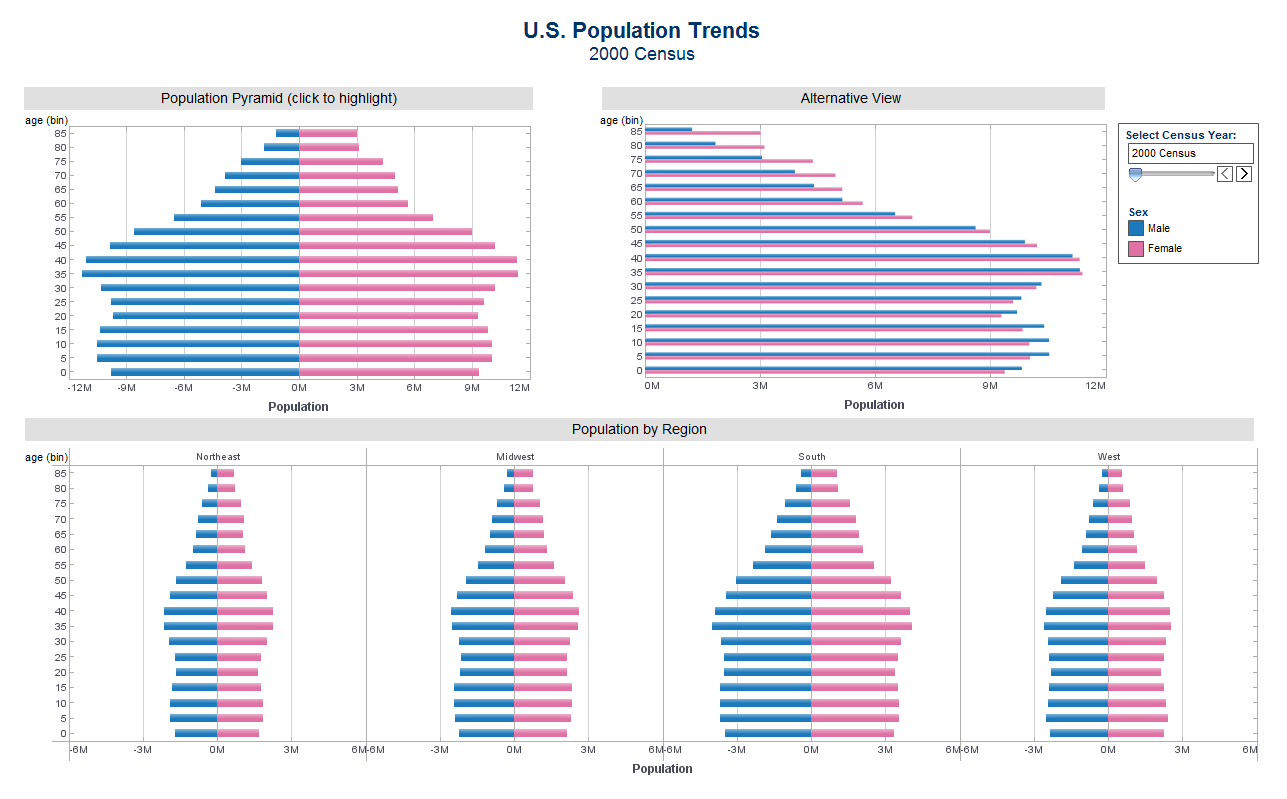
TDWI Las Vegas, NV - February 20, 2007 – InetSoft Technology, a leading provider of Operational Business Intelligence (BI) solutions, today announced the debut of Style Scope™ software, an unparalleled self-service tool with which to visually explore business and operational data from multiple disparate sources, in real-time.
InetSoft Style Scope software will be unveiled and showcased at the TDWI World Conference and Exposition, February 20-21 at Caesar’s Palace in Las Vegas, NV booth #403.
Style Scope dashboard software combines InetSoft’s patent-pending Data Block™ technology with an easy-to-use graphic interface and the ability to easily access disparate data sources for highly dynamic, real-time exploration and visual analysis. Its unique open-standards architecture and collaborative platform allows companies to leverage their existing “traditional” BI infrastructure with fast and seamless integration to existing data warehouses, operational data stores, legacy systems, databases, spreadsheets and almost any external data source.
“As performance management becomes more closely intertwined with operations, Business Intelligence itself is moving ever closer to operations,” said Luke Liang, CEO of InetSoft. “By visually exploring dynamic data, feedback and input to operations and business managers can be immediate and impactful.”
"In the realm of education, timely and accurate distribution of data is vital to improving student performance. By offering InetSoft's Style Scope™, our clients can easily create meaningful views of the data, which are specific to their immediate reporting needs," said Shawn Bay, Founder and CEO of eScholar LLC. "Placing easy-to-use visual analytical tools in the hands of our customers saves us time and money, while increasing customer satisfaction and brand loyalty."
With Style Scope, business users can build advanced BI requirements from the results of exploration, drastically improving the efficiency and effectiveness of their existing BI implementation, while reducing the pressure placed on IT resources.
InetSoft establishes a revolutionary new approach to business intelligence, incorporating the best practices of traditional BI with the fundamentals of operational BI, which are: real-time integration, collaboration, and exploration. This approach drives direct productivity gains throughout an organization and minimizes both the initial IT investment and on-going maintenance.
About InetSoft
Since 1996 InetSoft has been delivering easy, agile, and robust business intelligence software that makes it possible for organizations and solution providers of all sizes to deploy or embed full-featured business intelligence solutions. Application highlights include visually-compelling and interactive dashboards that ensure greater end-user adoption plus pixel-perfect report generation, scheduling, and bursting. InetSoft’s patent pending Data Block™ technology enables productive reuse of queries and a unique capability for end-user defined data mashup. This capability combined with efficient information access enabled by InetSoft’s visual analysis technologies allows maximum self-service that benefits the average business user, the IT administrator, and the developer. InetSoft solutions have been deployed at over 3,000 organizations worldwide, including 25% of Fortune 500 companies, spanning all types of industries.
Contact
For more information, media and analysts may contact:
Mark Flaherty
InetSoft Technology Corp.
+1.732.424.0400 x 936
mark.flaherty@inetsoft.com
www.inetsoft.com
Quotable
“In the realm of education, timely and accurate distribution of data is vital to improving student performance. By offering InetSoft's Style Scope, our clients can easily create meaningful views of the data, which are specific to their immediate reporting needs.”
Visualization Examples

