Explaining Trend Analysis
Trending and forecasting analysis displays trends over time for measures such as product sales, market share or average selling price. Trends are typically observed by plotting historical data over time on a chart display. This can be easily accomplished using InetSoft’s Style Intelligence.
Sales Trend (Historical data)
A prevalent use of trend analysis is to determine if the current value of a measure is an exception to the expected trend. To do this manually requires the observer to review the data on a regular basis that is inefficient and time-consuming.
An InetSoft scorecard with alert notification eliminates the need for this manual process by automating the data review efforts and will send an alert notification to the relevant people when an exception is detected.


Forecasting (seasonal effect accounted)

Extrapolating Trend Lines
A natural extension of trend analysis is to extrapolate the trend into the future for forecasting analysis. As the extrapolation may depend on parameters unique to each individual industry, it has been observed that a general forecasting engine is usually not suitable and could extrapolate incorrect trends when these parameters are not taken into account.
Forecasting Using Least Squares Method
To overcome this limitation, InetSoft provides the forecasting analysis through our flexible Data Block technology where the unique parameters required can be individually built into the extrapolation formula. As shown below, the forecast_seasonal line is more accurate and accounts for the bi-yearly Winter Olympics sales effect when compared to the forecast based on the Least Squares (LS) regression forecast model.

Forecasting with InetSoft Data Block:
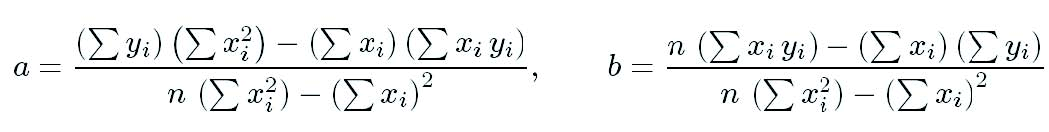
The linear Least Squares (LS) regression is based on y = a + bx. To determine the constants a and b, we can make use of the following formulas:
To use the least squares regression formula, create the SalesData data block for the sales data collected. To obtain the desired values, group by the Sales Date, aggregate the total sales revenue (y) and obtain the sales quarter(x).
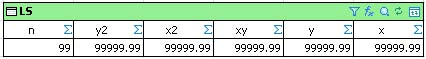
To determine the values of a and b, build the LS data block on top of the SalesData data block to calculate the required values (i.e. xy, x2, y2) per the stated formulas.
The Forecast data block below uses the LS data block to calculate the sales forecast based on the LS regression method y = a + bx. The values are tabulated in the Calculated_forecast table (i.e. y1).
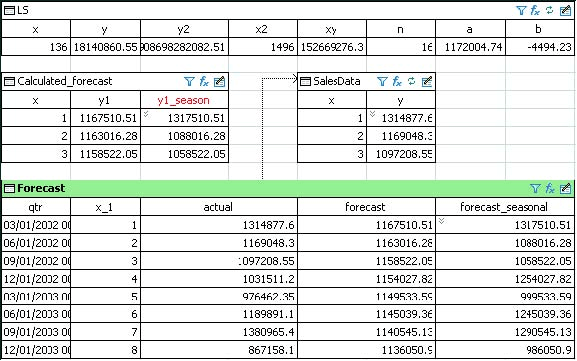
Based on current market research, the sales revenue for this industry has peaks and valleys based on the Winter Olympics bi-yearly schedule. To accommodate for this sales pattern, we incorporated an offset formula into the LS forecast values to provide the values in the y1_season column.
The Forecast table gathers the actual sales data, the LS forecast and the modified LS forecast to be used as the dataset for the chart. As demonstrated, you can easily add more parameters or complex calculations to your data block in order to obtain a more accurate forecast for your particular needs.
With this approach to the forecasting analysis, InetSoft provides a necessary tool for forecasting analysis so that the extrapolated trend is suitable and accurate for each unique case. Typical extrapolation formulas can be built using the Data Block technology for general forecasting analysis and then expanded or modified to account for unique parameters in the monitored measure to provide a more accurate forecast.
How Can Artificial Intelligence Help With Trend Analysis?
Artificial Intelligence (AI) is transforming trend analysis by providing deeper insights, improving accuracy, and enabling real-time decision-making. Businesses across industries leverage AI to detect patterns, predict future trends, and optimize strategies. Here's how AI helps with trend analysis:
1. Data Collection & Integration
AI automates the process of gathering and integrating large volumes of data from multiple sources, including social media, market reports, news articles, and financial statements. This eliminates manual effort and ensures a comprehensive dataset for analysis.
2. Pattern Recognition & Anomaly Detection
AI-powered algorithms can identify recurring patterns and detect anomalies that may indicate emerging trends or market shifts. Machine learning (ML) models analyze historical data to understand what normal trends look like and flag deviations that could signal new opportunities or risks.
3. Sentiment Analysis
Natural Language Processing (NLP) enables AI to analyze consumer sentiment by scanning online reviews, social media posts, and customer feedback. By gauging public perception, companies can anticipate shifts in consumer preferences and adapt their strategies accordingly.
4. Predictive Analytics
AI-driven predictive analytics uses historical data to forecast future trends. Machine learning models consider seasonality, economic indicators, and other variables to provide more accurate predictions than traditional statistical methods.
5. Real-Time Monitoring
AI enables businesses to monitor trends in real time, allowing for faster response to market changes. Automated alerts notify decision-makers about sudden shifts, helping them adapt quickly to competitive or economic developments.
6. Competitive Analysis
AI analyzes competitors' strategies, pricing, and product launches to identify gaps and opportunities in the market. Companies can adjust their offerings based on competitive insights to maintain an edge.
7. Image & Video Recognition
Computer vision allows AI to analyze visual content, such as social media images and videos, to track emerging trends in fashion, consumer behavior, and branding.
8. Supply Chain & Demand Forecasting
AI helps manufacturers and retailers predict demand trends more accurately, reducing waste and optimizing inventory management. This ensures businesses stay ahead of fluctuations in consumer demand.
9. Automated Reporting & Visualization
AI-powered dashboards and data visualization tools present trends in an easily digestible format, allowing executives to make informed decisions without getting lost in raw data.
10. Fraud & Risk Detection
AI identifies suspicious trends in financial transactions, cybersecurity threats, or fraudulent activities, protecting businesses from risks before they escalate.