Style Scope Agile Edition Training Videos


These videos are provided to help you take full advantage of the features of Style Scope Agile Edition. Looking for more comprehensive instructions, or to search for a particular feature? Access the Style Scope Agile Documentation here.
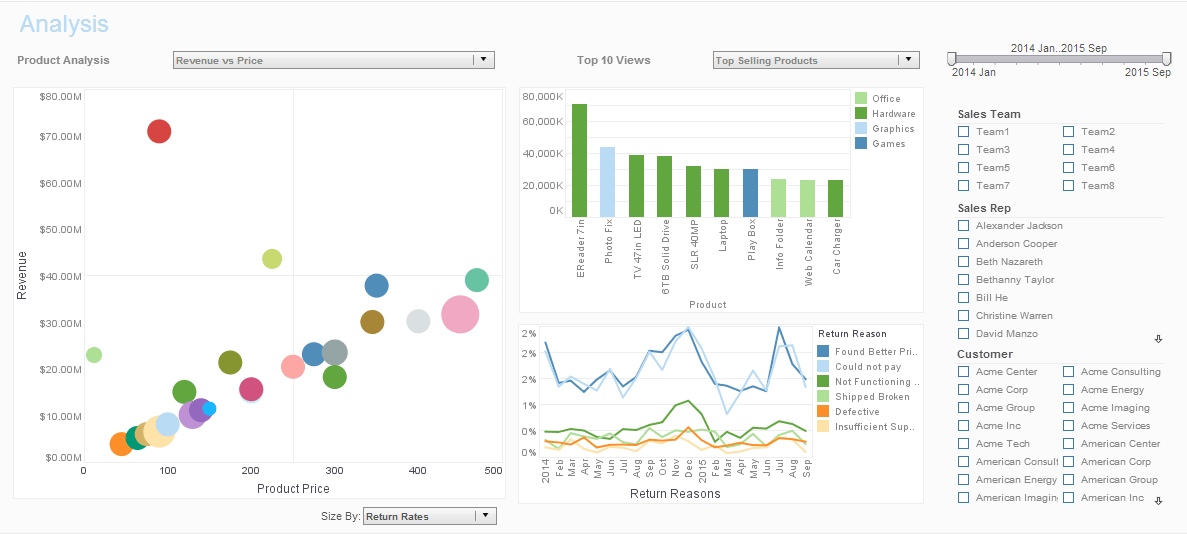
Interactive Analysis Dashboard

Get Familiar With Style Scope Agile Edition

Overview

Intro and Getting Started
  • The basic getting started process for InetSoft's Style Scope Agile Edition
Overview and Walkthrough
  • Overview and walkthrough of basic Style Scope Agile Edition features

Using the Portal

Creating a Folder or Asset
  • Creating a new dashboard folder
  • Creating a new data set folder
Moving or Deleting an Asset
  • Moving, deleting, and recovering a dashboard, data set, or folder
Distributing a Dashboard
  • Emailing a dashboard, exporting a dashboard
Scheduling a Dashboard
  • Automatically emailing a dashboard on a specified schedule
  • Deleting/editing a scheduled task
Refreshing Dashboard Data
  • Refreshing a dashboard from a live data connection
  • Recalculating dashboard scripts
Bookmarking a Dashboard
  • Using a bookmark to save dashboard settings
  • Creating a new bookmark
Annotating a Dashboard
  • Adding a dashboard/component-level annotation
  • Adding a data-level annotation

Accessing Your Data

Connecting to a Database
  • Creating and editing a database connection
Creating a Data Set from an Excel or Text File
  • Importing data from Excel or text file.
  • Opening a data set for editing
Creating a Data Set from Database Tables
  • Verifying an active database connection
  • Creating a new data set from database tables
Creating a Data Set from a Mashup
  • Mashing up data sets using an inner join
  • Mashing up data sets using a concatenation
Creating a Data Set by Manually Entering Data
  • Creating a new data set by manually typing data
  • Changing the column data type for an embedded table
Unpivoting a Table
  • Unpivoting data in an imported crosstab
  • Renaming a data set column

Build Your First Dashboard


Laying Out Dashboards

Creating a Dashboard
  • Adding components to a dashboard
  • Moving and resizing dashboard components
Creating a Multi-level Dashboard
  • Placing components into a tabbed interface
  • Changing tab labels
  • Grouping multiple components into a single tab
Styling a Dashboard
  • Adding an image/logo to a dashboard
  • Using an image/shape component as a background
Formatting Data in a Dashboard
  • Changing font, size, color using the toolbar
  • Formatting numerical data
Highlighting Data
  • Applying conditional formatting (highlights) to a chart/table
Building Interactivity with Form Components
  • Using the ad hoc crosstab/chart editor
  • Adding a label to a Form component
Hiding and Showing Dashboard Components
  • Combining components into a tabbed interface
  • Controlling component visibility with Form components
Sizing a dashboard for different devices and print
  • Defining a dashboard layout for devices of different sizes.
  • Defining a dashboard layout for print.

Creating Charts

Creating a Basic Chart
  • Adding a chart component to a dashboard
  • Positioning a chart on the dashboard
Creating a Pie Chart
  • Creating and formatting a pie chart on a dashboard
Creating a Bubble Chart
  • Adding a chart component to a dashboard.
  • Positioning a chart on the dashboard.
Adding Trend Lines to a Chart
  • Adding trend lines to a chart
  • Projecting trend lines into the future
Displaying Multiple Measures on a Chart
  • Creating a chart using multiple measures
Displaying Multiple Dimensions on a Chart
  • Adding multiple dimensions to a chart
Understanding Chart/Crosstab Dimensions and Measures
  • Adding dimensions and measures to a chart or crosstab
Creating Dual-Axis Chart
  • Adding dimensions and measures to a chart
  • Adding multiple measures to a chart axis
Creating a Grid of Charts
  • Adding multiple dimensions/measures to a chart axis in a grid
Creating a Map
  • Charting data on a map

Filtering Data

Eight Ways to Filter Data
  • Filtering at the data set level
  • Filtering with selection components
Filtering Data Directly on a Chart
  • Filtering aggregated chart data with an ad hoc filter
  • Filtering a chart by brushing data
Filtering Date Ranges
  • Filtering date ranges with a range slider
  • Filtering date ranges with a calendar
Filtering Categorical Data
  • Filtering categorical data with a selection list
  • Setting selection list properties
Filtering Numerical Data
  • Filtering numerical data with a range slider
  • Setting range slider properties
Filtering Aggregated Data
  • Filtering aggregated chart data with an ad hoc filter
  • Filtering aggregated crosstab data with an ad hoc filter
Filtering Data on Multiple Dimensions
  • Filtering with a selection list
  • Filtering with multiple selection lists and trees
Filtering with Hierarchy
  • Filtering with a selection tree
  • Searching a selection tree
  • Modifying the selection tree hierarchy
Filtering (Ranking) the "Top N" Groups
  • Ranking the top N groups in a chart by aggregate value
  • Sorting groups in a chart by aggregate value
Filtering With Parameters
  • Adding form components (ComboBox, RadioButton, Spinner)
  • Renaming a component
Highlighting Data
  • Applying conditional formatting (highlights) to a chart/table
Filtering across Multiple Dashboards
  • Sharing filters between modules in a composite dashboard
  • Hiding components in an embedded dashboard
Filtering Data on the Data Layer
  • Creating a simple filter condition using an AND operator
  • Creating an advanced filter condition using an OR operator
Limiting the Size of a Data Set
  • Applying a filtering condition to a data set
  • Filtering a data set that does not support conditions
'

Go Deeper

Mashing Up Data

Joining Data Sets
  • Mashing up data sets using an inner or outer join
Changing the Join Type
  • Changing an inner join to an outer join
  • Adding joins to a joined data set
Concatenating Data Sets (Union, Intersect, Minus)
  • Mashing up data sets using a union concatenation
  • Mashing up data sets using a intersect concatenation

Grouping Data

Grouping Data in a Data Set
  • Grouping and aggregating data in a data set
  • Joining grouped and detail data
Grouping Data in a Chart
  • Grouping and aggregating data in a data set
  • Joining grouped and detail data
Grouping Data in a Crosstab
  • Grouping data in a row or column header
  • Changing the grouping level for date fields
Displaying a Single Aggregate Value
  • Displaying aggregated data in a Text/Gauge component
Grouping Data Dynamically
  • Changing grouping and aggregation via ad hoc editing
  • Disabling end-user ad hoc editing for chart and crosstab
Drilling Down in Grouped Data
  • Displaying/exporting detail data for a chart or crosstab

Creating Crosstabs/Pivot Tables

Understanding Chart/Crosstab Dimensions and Measures
  • Adding dimensions and measures to a chart/crosstab
Creating a Basic Crosstab/Pivot Table
  • Adding a crosstab/pivot table to a dashboard
  • Opening the crosstab editor
  • Changing the grouping level for a date field
Creating a Crosstab with Formula Cells
  • Converting a crosstab into a freehand table
  • Adding formulas/expressions into a table
  • Adding multiple independent dimensions into a crosstab

Performing Calculations

Where to Perform Calculations
  • Adding an expression column to a data set
  • Adding a calculated field to a dashboard
Performing Date Calculations
  • Adding an expression column to a data set
  • Adding a calculated field to a dashboard
Performing String Calculations
  • Adding an expression column to a data set
  • Adding a calculated field to a dashboard
  • Concatenating strings
Performing Calculations on Detail Data
  • Adding a detail-level expression column to a data set
  • Adding a detail-level calculated field to a dashboard
Performing Calculations on Aggregated Data
  • Grouping and aggregating a data set
  • Creating a mirror of an aggregated data set
  • Adding an aggregate-level expression column to a data set

Administration

Creating Users and Groups
  • Creating and editing users/groups
  • Deleting users
Assigning Permissions to Users and Groups
  • Assigning permissions for folders, dashboards, and data sets
Restoring from Backup
  • Recovering assets from an automatic backup
Caching Data for Performance
  • Enabling high-performance data caching