What Are the Metrics Tracked on LLM Performance Dashboards?
Large Language Model (LLM) performance dashboards exist to answer a few core questions: How fast is the model? How good are its answers? How much does it cost? and Is it behaving safely and reliably? To do that, they track a set of recurring metrics that fall into four broad categories: latency and throughput, token and cost metrics, quality and safety metrics, and system reliability and user experience metrics.
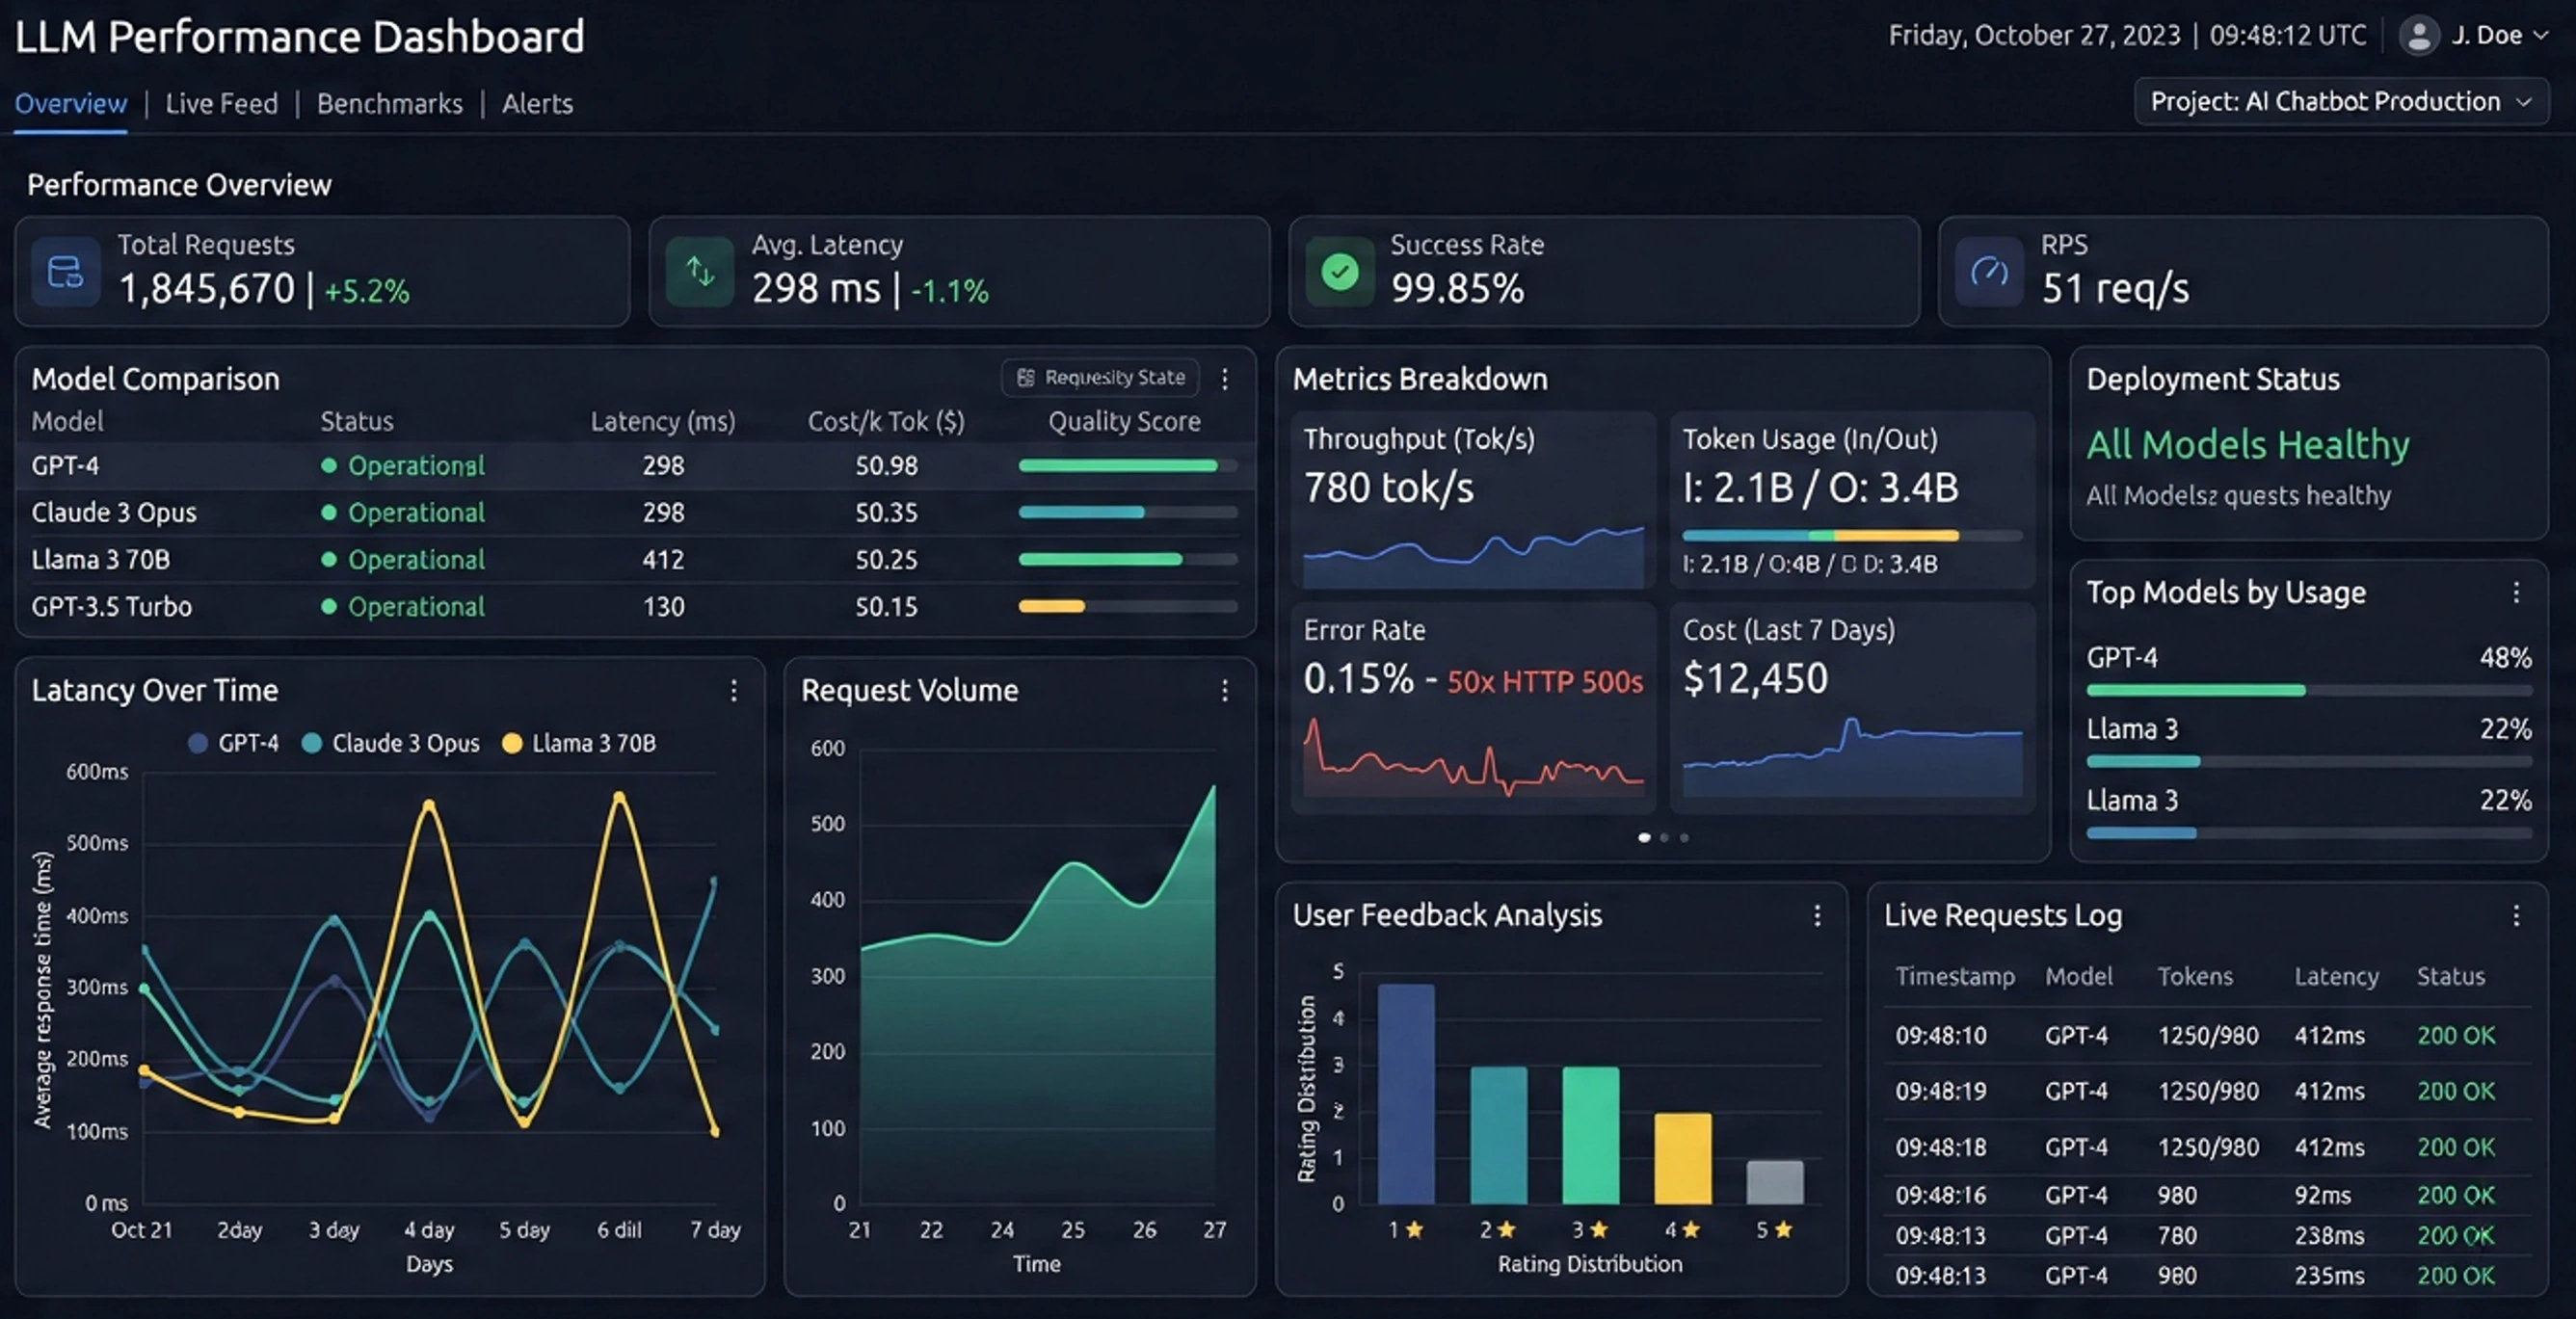
Below is a breakdown of the most common metrics you will see on an LLM performance dashboard, what they mean, and the levers you can pull to affect them in practice.


Latency metrics
Time to First Token (TTFT)
What it is: TTFT is the time from when a request is sent to the model until the first token of the response is received. It captures the “initial wait” before the model starts streaming anything back.
Why it matters: TTFT drives perceived responsiveness. In chat-style or interactive tools, users care more about how quickly something starts to appear than how long the full answer takes. A low TTFT makes the system feel snappy; a high TTFT makes it feel sluggish even if the rest of the generation is fast.
How to reduce TTFT:
- Shorten prompts: Long prompts increase the prefill work the model must do before generating.
- Use prompt caching: Cache embeddings or KV caches for repeated system or context prompts.
- Scale infrastructure: Reduce queueing by adding replicas, autoscaling, or prioritizing interactive traffic.
- Optimize model serving: Use optimized runtimes, quantization, or smaller models for latency-sensitive paths.
End-to-End Latency
What it is: End-to-end latency is the total time from request arrival to the last token of the response. It includes TTFT plus the time to generate all tokens.
Why it matters: This is the “full wait time” for a user or downstream system. For batch jobs, report generation, or API consumers that need the complete response, end-to-end latency is the key metric.
How to reduce end-to-end latency:
- Limit maximum output length: Fewer tokens generated means shorter total time.
- Use higher decoding speed: Techniques like optimized kernels, better hardware, or quantization increase tokens per second.
- Tune decoding parameters: Slightly higher temperature or different sampling strategies can reduce “thinking loops” and overly long answers.
- Precompute or cache: For recurring tasks, pre-generate or partially cache responses where possible.
Inter-token Latency / Streaming Smoothness
What it is: Inter-token latency measures the time between consecutive tokens during streaming. It is closely related to tokens per second but focuses on the “rhythm” of the stream.
Why it matters: Even if TTFT is low, choppy or bursty token streaming feels bad to users. Smooth, consistent token flow improves the sense of real-time interaction.
How to improve it: Use efficient serving stacks, avoid overloading a single GPU or node, and tune batching so that it increases throughput without causing long pauses between tokens for any one user.
Throughput metrics
Tokens per Second (TPS)
What it is: TPS measures how many tokens the system generates per second across requests. It is a core throughput metric for LLM inference.
Why it matters: Higher TPS means you can serve more work with the same hardware, lowering cost per request and enabling higher concurrency. It is especially important for batch workloads and high-traffic applications.
How to increase TPS:
- Use batching: Serve multiple requests together to better utilize GPU compute.
- Optimize model size and precision: Smaller or quantized models (e.g., 4-bit, 8-bit) often yield higher TPS.
- Choose efficient runtimes: Use inference-optimized libraries and kernels designed for LLMs.
- Right-size hardware: Match model size and sequence lengths to GPU memory and bandwidth.
Requests per Second (RPS)
What it is: RPS counts how many requests the system successfully handles per second. It is a classic capacity metric.
Why it matters: RPS tells you whether your system can handle peak traffic without queueing or timeouts. It is often tracked alongside error rates and latency percentiles.
How to increase RPS: Improve TPS, add replicas, use autoscaling, and limit per-request token budgets so each request is cheaper to serve, allowing more concurrent requests.

Token and cost metrics
Input Tokens, Output Tokens, and Total Tokens
What they are: Dashboards typically track:
- Input tokens: Tokens in the prompt (system, user, and context).
- Output tokens: Tokens generated by the model.
- Total tokens: Sum of input and output tokens per request or over time.
Why they matter: Most LLM pricing is token-based. Token counts directly drive cost, and they also correlate with latency and throughput. Long prompts and long answers are expensive and slow.
How to control token usage:
- Prompt compression: Remove redundant text, shorten instructions, and use structured formats.
- Context management: Use retrieval to include only relevant documents instead of dumping entire knowledge bases.
- Max token limits: Enforce strict caps on output length per use case.
- Template reuse: Standardize prompts so they are concise and reusable across flows.
Cost per 1K Tokens / Cost per Request
What it is: Cost metrics estimate how much you pay per 1,000 tokens or per request, based on provider pricing or internal cost models (e.g., GPU-hour cost divided by tokens served).
Why it matters: Cost is the bridge between technical performance and business viability. A model can be fast and accurate but still unusable if cost per request is too high.
How to reduce cost:
- Use smaller or cheaper models where possible: Route simple tasks to lighter models.
- Aggressively manage tokens: Reduce both prompt and completion lengths.
- Improve throughput: Higher TPS lowers cost per token on fixed hardware.
- Tiered routing: Use a cascade: cheap model first, escalate to larger models only when needed.

Quality and safety metrics
Accuracy / Task Success Rate
What it is: Accuracy metrics measure how often the model produces correct or acceptable answers for a given task. This can be benchmark scores (e.g., on evaluation datasets) or application-specific success rates (e.g., “did the answer pass validation?”).
Why it matters: High speed and low cost are meaningless if the answers are wrong. Accuracy is the core measure of whether the model is actually solving the user’s problem.
How to improve accuracy:
- Better prompting: Clear instructions, examples, and constraints often boost reliability.
- Retrieval-augmented generation: Ground the model in up-to-date, domain-specific data.
- Model choice and fine-tuning: Use models tuned for your domain or fine-tune on your own data.
- Post-validation: Add rule-based or model-based checkers to catch and correct errors.
Hallucination Rate
What it is: Hallucination rate measures how often the model produces confident but false or unsupported statements. It is usually estimated via evaluation sets, human review, or automated fact-checking.
Why it matters: Hallucinations erode trust. In many domains (legal, medical, financial), even occasional hallucinations can be unacceptable.
How to reduce hallucinations:
- Grounding and retrieval: Always provide relevant context and instruct the model to stick to it.
- Refusal behavior: Encourage the model to say “I don’t know” when information is missing.
- Constrained generation: Use tools, schemas, or structured outputs to limit free-form fabrication.
- Secondary checks: Use another model or rules to verify factual claims before surfacing them.

Safety and Policy Violation Metrics
What they are: These track how often responses violate safety policies (e.g., harmful content, personal data leakage, disallowed topics). They may be measured as violation rate or number of blocked responses.
Why they matter: Safety metrics protect users, organizations, and compliance posture. They are critical in regulated or consumer-facing environments.
How to improve safety metrics: Use safety-tuned models, add moderation layers before and after generation, and refine prompts to discourage unsafe content. Regularly review flagged examples and update policies and filters.
Reliability and user experience metrics
Error Rate and Timeout Rate
What they are: Error rate tracks failed requests (e.g., 5xx errors, model failures), while timeout rate tracks requests that exceeded a time limit.
Why they matter: Even with good average performance, high error or timeout rates make the system feel unreliable and can break integrations.
How to reduce them: Improve autoscaling, add retries with backoff, set realistic timeouts, and monitor upstream dependencies (vector stores, databases, tools) that might be slowing down or failing.
Queue Length and Utilization
What they are: Queue length shows how many requests are waiting to be served. Utilization shows how busy your hardware is (e.g., GPU utilization).
Why they matter: Long queues correlate with high latency and poor user experience. Very low utilization may indicate overprovisioning or inefficient batching.
How to affect them: Tune concurrency and batching, adjust autoscaling thresholds, and separate latency-sensitive traffic from bulk workloads so they do not block each other.

User Satisfaction and Feedback
What it is: Many dashboards include thumbs-up/down, ratings, or task-completion metrics derived from user feedback.
Why it matters: Technical metrics are proxies; user satisfaction is the ground truth of whether the system is working for real people.
How to improve it: Combine all the levers above—latency, cost, accuracy, safety—and iterate on prompts, UX, and routing strategies. Use feedback to identify failure patterns and feed them back into evaluation and fine-tuning.
Putting it all together
An effective LLM performance dashboard does not just show numbers; it reveals trade-offs. Lowering latency might increase cost. Using a smaller model might hurt accuracy but improve throughput. The goal is to choose a set of metrics that reflect your real-world priorities—speed, quality, safety, and cost—and then design prompts, routing, infrastructure, and evaluation loops that move those metrics in the right direction.
When you read an LLM dashboard, ask yourself three questions: What does this metric mean for the user? What knobs do I actually have to change it? and What trade-off am I willing to make? Once you can answer those, the dashboard stops being a wall of numbers and becomes a control panel you can actually steer.