Best Visual Dashboards
InetSoft's dashboard builder tool, StyleBI, can create some of the most visually pleasing dashboards around. Dashboards have been established as a highly effective business intelligence tool that can be used for monitoring performance or analyzing data.
Below you will find many examples of professional dashboards created from scratch with StyleBI
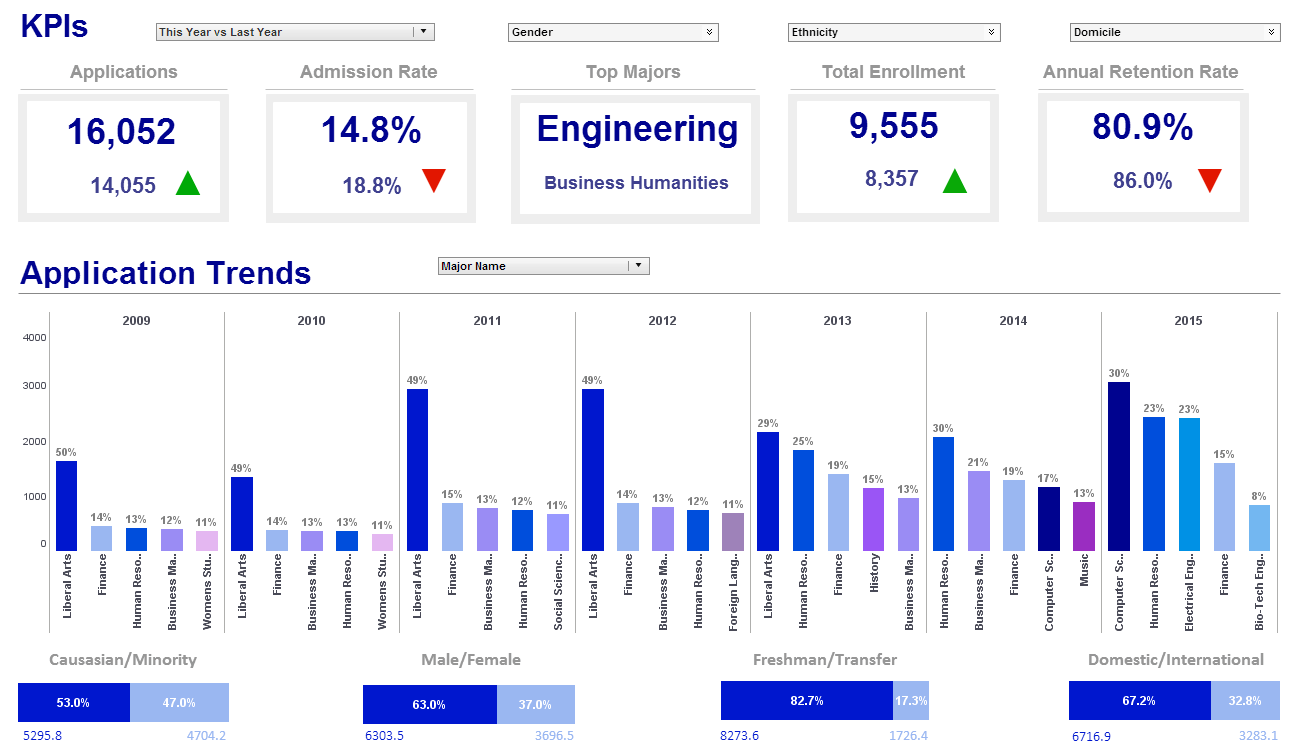
Education KPI Dashboard
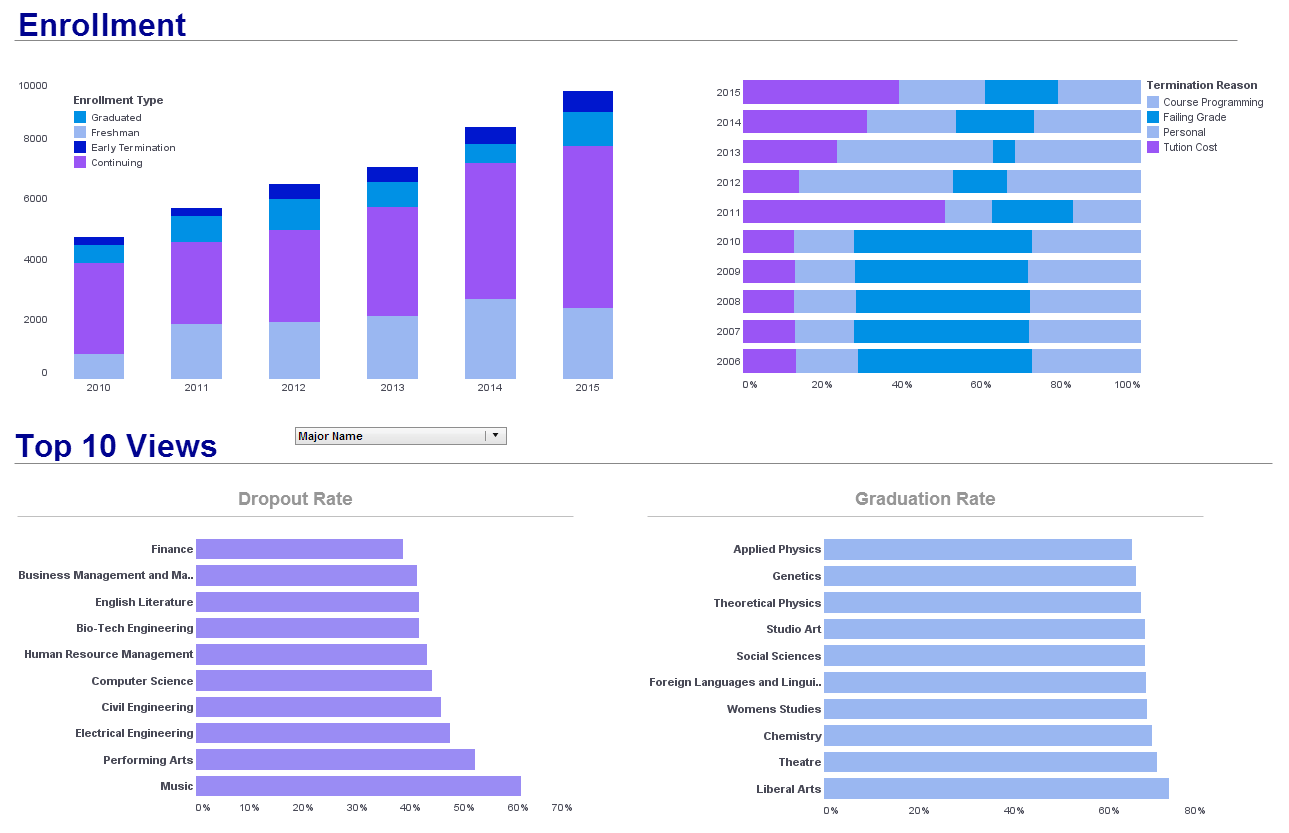
University Enrollment Dashboard

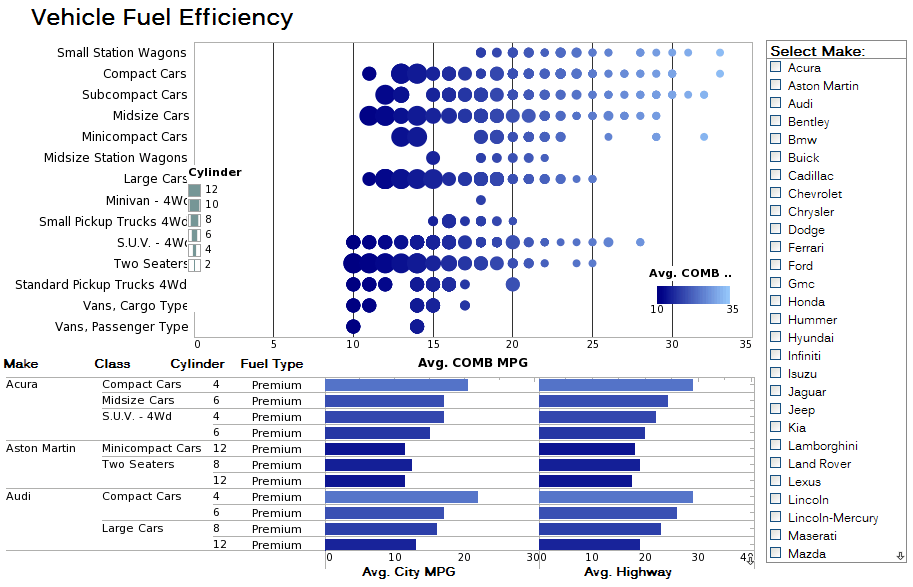
Data Discovery Example
Leveraging InetSoft's StyleBI for Specialty Metals and Fiberglass Supplier Dashboards
In the highly competitive and complex world of specialty metals and fiberglass supply chains, real-time data insights are critical for operational efficiency, supplier management, and strategic decision-making. For IT professionals tasked with implementing robust business intelligence (BI) solutions, InetSoft's StyleBI, an open-source-compatible BI platform, offers a powerful, flexible, and cost-effective tool to create interactive dashboards. This article explores how a supplier of specialty metals and fiberglass can harness StyleBI to build dashboards that empower stakeholders, streamline operations, and drive business success, with a focus on the technical capabilities and benefits for an IT audience.
The Role of Dashboards in Specialty Metals and Fiberglass Supply Chains
The specialty metals and fiberglass industry operates in a niche market where precision, quality, and timely delivery are paramount. Suppliers deal with diverse challenges, including fluctuating raw material costs, stringent quality requirements, and complex logistics. Dashboards serve as a centralized interface to monitor key performance indicators (KPIs), such as supplier delivery times, inventory levels, product quality metrics, and customer order fulfillment rates. For IT teams, the challenge lies in delivering a BI solution that integrates disparate data sources, supports real-time analytics, and is accessible across platforms without requiring extensive development resources.
InetSoft's StyleBI stands out as a solution tailored for such demands. Its web-based, zero-client architecture, combined with a powerful data mashup engine, enables IT teams to deploy enterprise-grade dashboards that meet the unique needs of specialty materials suppliers. StyleBI's open-source compatibility further enhances its appeal, allowing IT departments to customize and scale solutions while minimizing costs.
Why StyleBI? Technical Advantages for IT Teams
StyleBI is a comprehensive BI platform that combines dashboarding, reporting, and analytics with a focus on ease of use, agility, and robustness. For IT professionals, several technical features make it an ideal choice for building dashboards in the specialty metals and fiberglass sector:
-
Web-Based, Zero-Client Architecture: StyleBI operates as a Java-based server application, accessible via any modern web browser (Chrome, Firefox, Edge) without requiring client-side installations. This reduces the burden on IT teams for software deployment and maintenance, ensuring compatibility across Windows, Linux, and macOS environments. For suppliers with distributed teams or remote stakeholders, this architecture supports seamless access to dashboards on desktops and mobile devices.
-
Data Mashup Engine: The specialty metals and fiberglass industry often relies on data from multiple sources, such as ERP systems (e.g., Epicor, SAP), CRM platforms (e.g., Salesforce, SugarCRM), and logistics databases. StyleBI's patented Data Block™ technology enables IT teams to integrate and transform data from disparate sources, including JDBC, Hadoop, Excel, and cloud-based platforms like Amazon Redshift. This capability allows for the creation of unified dashboards that provide a holistic view of operations without requiring extensive ETL (Extract, Transform, Load) processes.
-
Drag-and-Drop Designer: StyleBI's intuitive drag-and-drop interface empowers both IT professionals and business analysts to create visually compelling dashboards. For IT teams, this reduces the need for custom coding, accelerating development cycles. The designer supports real-time data visualization, enabling users to drop data elements into charts, gauges, and selection lists to uncover relationships and trends.
-
Open-Source Compatibility: While StyleBI is a commercial product, it offers open-source compatibility through its community edition, available on GitHub. This allows IT teams with development expertise to customize the platform, integrate it with existing systems, or contribute to its codebase. The open-source model is particularly appealing for cost-conscious suppliers, as it provides access to enterprise-grade features without the high licensing costs of competitors like Tableau.
-
Scalability and Performance: StyleBI's server-based architecture supports load balancing and failover through built-in clustering or J2EE server clustering. This ensures high availability and performance, critical for suppliers dealing with large volumes of transactional data. The platform's ability to handle high-speed parallel processing further enhances its suitability for real-time analytics in dynamic supply chain environments.
Building Dashboards for Specialty Metals and Fiberglass Suppliers
To illustrate how StyleBI can be applied, consider a hypothetical supplier, Specialty Materials Inc., which provides high-grade titanium alloys and fiberglass composites to aerospace and automotive industries. The company needs dashboards to monitor supplier performance, inventory, quality control, and customer satisfaction. Below, we outline how IT teams can leverage StyleBI to address these needs.
1. Supplier Performance Dashboard
Objective: Track supplier delivery times, product quality, and compliance with contractual terms to optimize supplier relationships.
Implementation: Using StyleBI's data mashup engine, IT teams integrate data from the company's ERP system (e.g., Epicor) and supplier management software. The dashboard features:
-
KPIs: On-time delivery rate, defect rate, and supplier lead time.
-
Visualizations: Bar charts for delivery performance, scatter plots for quality metrics, and gauges for compliance scores.
-
Interactivity: Drill-down capabilities allow users to view detailed supplier data, such as individual shipment records or quality inspection reports.
Technical Notes: IT teams configure StyleBI to pull real-time data via JDBC connectors, ensuring up-to-date metrics. The dashboard is hosted on a clustered server to handle high user concurrency, and role-based access controls restrict sensitive supplier data to authorized personnel.
2. Inventory Management Dashboard
Objective: Monitor inventory levels, turnover rates, and stock shortages to prevent production delays.
Implementation: StyleBI connects to inventory databases and logistics systems, enabling the creation of a dashboard with:
-
KPIs: Inventory turnover ratio, stock-out frequency, and carrying costs.
-
Visualizations: Line charts for inventory trends, heatmaps for stock levels across warehouses, and alerts for low-stock items.
-
Self-Service Features: Business users can customize views using StyleBI's ad-hoc reporting tools, reducing IT support requests.
Technical Notes: The IT team leverages StyleBI's Hadoop connector for large-scale inventory data and implements live page streaming to display updates as data is processed. The dashboard is optimized for mobile access, allowing warehouse managers to monitor stock levels on tablets.
3. Quality Control Dashboard
Objective: Ensure that specialty metals and fiberglass meet industry standards (e.g., ASTM, ISO) through real-time quality monitoring.
Implementation: StyleBI integrates with quality management systems and IoT sensors on production lines. The dashboard includes:
-
KPIs: Defect rates, compliance with specifications, and testing turnaround time.
-
Visualizations: Roscoe's (1984) insight on the importance of quality control in manufacturing is particularly relevant: "Quality is not an act, it is a habit." StyleBI enables IT teams to embed this habit into dashboards with:
-
Real-Time Monitoring: Gauges for live sensor data, bar charts for defect trends, and tables for test results.
-
Data Mashup: Combining sensor data with historical quality records to identify patterns.
Technical Notes: IT teams use StyleBI's high-speed parallel processing to handle real-time IoT data streams. The dashboard is configured with automated alerts for out-of-specification metrics, sent via email or displayed on-screen.
4. Customer Satisfaction Dashboard
Objective: Analyze customer feedback and order fulfillment metrics to enhance service quality.
Implementation: StyleBI connects to CRM platforms (e.g., Salesforce) and order management systems to create a dashboard with:
-
KPIs: Net Promoter Score (NPS), order fulfillment rate, and customer retention rate.
-
Visualizations: Pie charts for feedback categories, trend lines for satisfaction scores, and maps for delivery locations.
-
Ad-Hoc Reporting: Users can dynamically add new data fields (e.g., survey responses) without IT intervention.
Technical Notes: The IT team uses StyleBI's Salesforce connector for seamless CRM integration. The dashboard is embedded in the company's .NET portal using IFRAMES, with single sign-on (SSO) enabled via URL parameters for secure access.
Benefits for IT and Business Stakeholders
For IT teams, StyleBI reduces development and maintenance overhead through its user-friendly interface and open-source extensibility. The platform's compatibility with existing infrastructure (e.g., .NET, OLAP servers) minimizes integration challenges, while its scalability ensures long-term viability. Business stakeholders benefit from self-service dashboards that empower them to explore data, generate reports, and make data-driven decisions without relying on IT support.
Challenges and Considerations
While StyleBI offers significant advantages, IT teams should consider:
-
Learning Curve: Although user-friendly, mastering advanced features like data mashup may require training for less experienced developers.
-
Open-Source Limitations: The free version lacks some enterprise features (e.g., live connectivity to all data sources), which may necessitate a commercial license for large-scale deployments.
-
Data Security: IT teams must configure role-based permissions and encryption to protect sensitive supplier and customer data.


