Business Data Visualization
Visualization is the subsection of analysis that turns data into visible insight. Traditional data visualization tools used to be aimed at highly trained professionals. They used complicated inputs and statistical models to enable their users to discover low-level patterns.
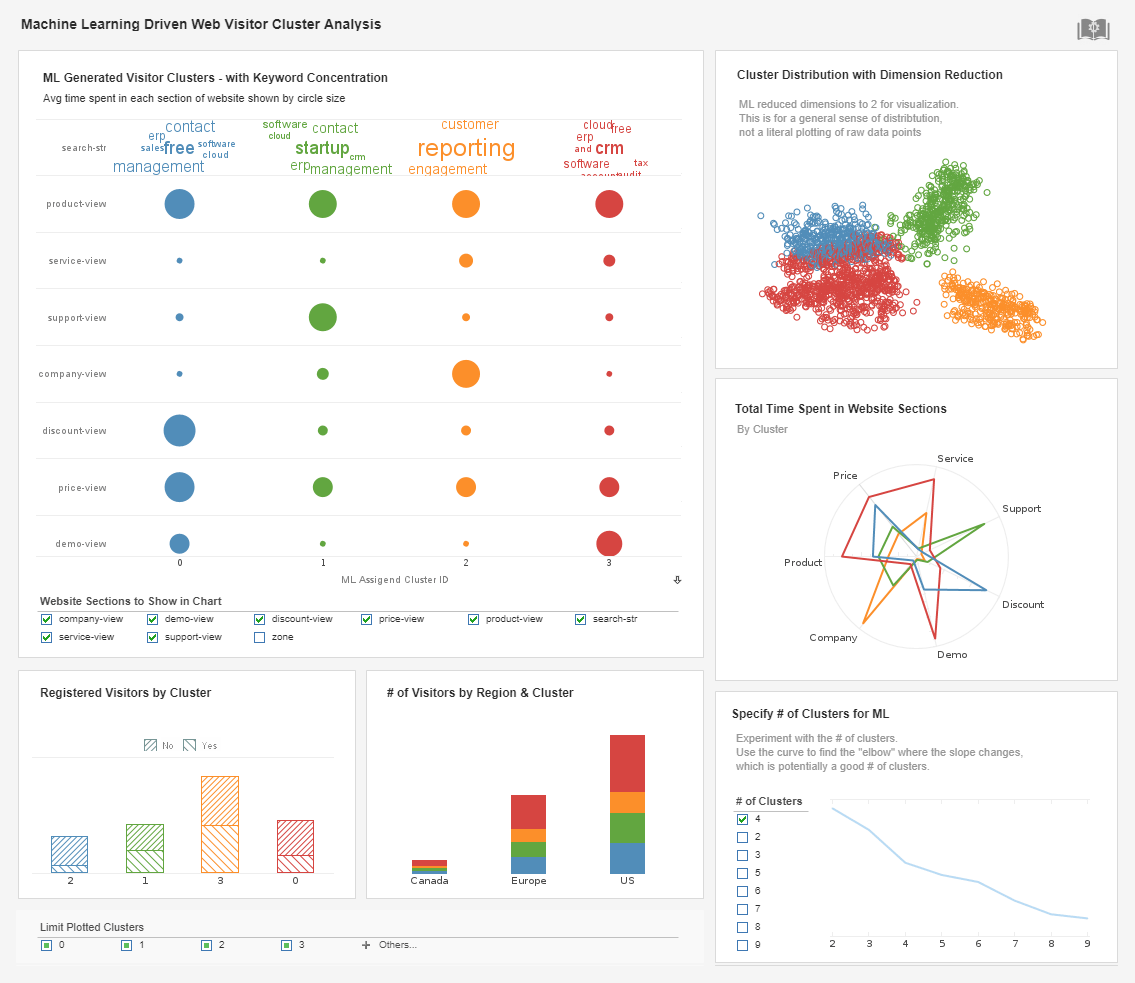
InetSoft’s visualization application, the viewsheet, is a business intelligence tool that brings the power of visualization to both business executives and mainstream users alike.
Because viewsheets allow users to interact with complex data using familiar objects such as charts, sliders, and check-boxes, they have a very fast learning curve. They allow seamless integration of data warehouses and other BI data stores with operational data sources for a complete view of an organization.
Visualization using viewsheets goes far beyond the ad hoc querying one may use to find answers to existing questions. With viewsheets, users are able to scrutinize data from every angle, unearth new patterns, test novel ideas, and envision fresh opportunities.
The viewsheet is used to isolate the data relationships developed in a data worksheet, and presents them within a visceral and interactive visual interface. Users can use the viewsheet to navigate any characteristic hierarchy in the data, and can tag new information for “what-if ” analysis and other advanced applications.
| #1 Ranking: Read how InetSoft was rated #1 for user adoption in G2's user survey-based index | Read More |
Exploratory Visualization
InetSoft’s data visualization solution is one of the most approachable and swiftest ways to aggregate and investigate enterprise data in a visually intelligible fashion. While other solutions require hours of meticulous backend IT development or are limited to desktop data such as spreadsheets, InetSoft allows just about any ordinary business user to build his/her own visual analyses and dashboards based on live enterprise data or data warehouses.
In the realm of Business Intelligence (BI), data visualization is applied in two ways: First, data visualization is a field of study that covers the complete theory of how to visually represent data. The concepts and systems can be applied in the execution of visual interfaces for transmitting information. Secondly, data visualization concepts and protocols are achieved through features in BI software which make them easy to apply.
Data visualization software provides features to easily compose visualizations that effectively communicate information. More importantly, the software guides and enforces the guidelines for effective visualization, enabling even a casual user to create satisfactory results.Read what InetSoft customers and partners have said about their selection of Style Report as their production reporting tool. |
InetSoft Opens Up Database Write-back Capability in its Business Intelligence Solution
InetSoft Technology, an innovator in data mashup driven dashboard and reporting solutions, announced a new release of its business intelligence platform, StyleBI. For the first time, users can not only view and analyze data but also input and modify data. Enterprises and solution providers can now build new types of Web-based applications that streamline business processes.
Examples of the types of applications that can be built with StyleBI’s drag and drop design tool are in the areas of:
- Financial planning – forecasting and budgeting often requires analysis of recent performance and historical trends so now planning assumptions can be created while analyzing the data.
- What-if modeling – as a specific example in planning, visual what-if modeling tools can be used to generate the inputs to be used in any departmental planning model.
- Data profiling – multi-dimensional charting can identify outliers, data entry errors, and omissions in externally supplied or user-generated data, and now corrections can be made in-place.
- Marketing lead importing – the process of cleansing imported leads can be made simpler and faster.
 |
Read the latest news about InetSoft's user friendly BI software and customer successes. |
"Our Business Analytics benchmark research shows that nearly half (47%) of business analysts rate taking action on the outcome of analytics very important," said David Menninger, Vice President and Research Director, Ventana Research. "The new write-back features in InetSoft StyleBI will make it easier for users to act on the findings of their analysis."
“We have listened to our customers express dissatisfaction with the historical separation of business intelligence and process-oriented applications,” explained Mark Flaherty, Chief Marketing Officer at InetSoft. “Knowing how easy-to-use our dashboard design tools and the resulting interactive analyses are, they have asked for the ability to not only read data, but write it. Paired with our unique data mashup engine, we see this release opening tremendous opportunities for businesses to streamline tasks and processes.”
StyleBI is a full-featured business intelligence solution for dashboard reporting that includes a powerful data mashup engine. End-users get visually compelling, highly interactive access to data, and IT gets a highly customizable, easy to learn and quick to deploy business intelligence toolset and information delivery platform. Data mashup capabilities allow for the integration of disparate data sources, enabling agile development and providing maximum self-service, while the application’s SOA architecture and open standards-based technology make for an ideal embedding and integration-ready application for dashboards, production reporting, and visualization. Additionally, data visualization in the context of BI often implies interactivity through the software. By enabling users to relate with data, the software opens overwhelming opportunities to view that data from a multitude of different angles. It reconstructs data visualization from being a presentation technology to being a fully analytical process.


