CEO Dashboard Software from InetSoft
How does the CEO of a canine vest supplier use dashboards? Dashboards provide a consolidated, real-time view of key performance indicators (KPIs), visualized through charts and analytics, enabling the CEO to monitor financial health, operational efficiency, customer satisfaction, and market positioning. Below is a detailed exploration of how a CEO uses StyleBI’s self-service reporting dashboards, focusing on specific KPIs, charts, and analytics tailored to their strategic needs.
Strategic Role of Dashboards for the CEO
CEOs require high-level insights to align operations with long-term goals, such as increasing market share, optimizing supply chains, and enhancing customer loyalty. StyleBI’s self-service reporting empowers the CEO to create, customize, and analyze reports without IT dependency, using its drag-and-drop interface and Data Block™ technology for seamless data integration. The CEO can access dashboards on mobile devices, ensuring flexibility during travel or stakeholder meetings, and use interactive features to drill down into data for deeper insights. These dashboards are customized to reflect the company’s branding, ensuring professional presentations for board meetings or investor discussions.


Key Performance Indicators (KPIs) Monitored
The CEO tracks a balanced mix of financial, customer, operational, and growth-oriented KPIs, inspired by frameworks like the Balanced Scorecard, to ensure holistic oversight. Below are the critical KPIs used, tailored to a canine vest supplier:
- Revenue Growth: Measures the percentage increase in sales revenue over time (e.g., month-over-month or year-over-year). The CEO uses this to assess market demand and the effectiveness of sales strategies. Formula: [(Current Revenue - Previous Revenue) / Previous Revenue] × 100.
- Profit Margin: Tracks net profit as a percentage of revenue, indicating financial health. For a canine vest supplier, this helps evaluate pricing strategies and cost management. Formula: (Net Profit / Revenue) × 100.
- Customer Retention Rate: Measures the percentage of repeat customers within a period, reflecting customer satisfaction with vest quality and service. High retention indicates brand loyalty. Formula: [(Customers at End of Period - New Customers) / Customers at Start of Period] × 100.
- Average Revenue Per Pet (ARPP): Calculates revenue divided by the number of pets served, identifying upselling opportunities for accessories like leashes or custom vests. Formula: Total Revenue / Number of Pets Served.
- Order Accuracy: Tracks the percentage of orders fulfilled correctly, critical for customer satisfaction in a niche market like canine vests. Formula: (Accurate Orders / Total Orders) × 100.
- Supplier Compliance Rate: Measures the percentage of suppliers meeting delivery and quality standards, ensuring reliable production of durable, comfortable vests. Formula: (Compliant Deliveries / Total Deliveries) × 100.
- Inventory Turnover: Assesses how often inventory is sold and replaced, optimizing stock levels to avoid overstocking or shortages. Formula: Cost of Goods Sold / Average Inventory.
- Customer Lifetime Value (CLV): Estimates total revenue expected from a customer over their relationship with the company, guiding marketing investments. Formula: Average Purchase Value × Purchase Frequency × Customer Lifespan.
- Lead Conversion Rate: Tracks the percentage of leads converted into customers, reflecting the effectiveness of marketing campaigns for canine vests. Formula: (Converted Leads / Total Leads) × 100.
- Employee Turnover Rate: Measures the percentage of employees leaving over a period, indicating team stability in a service-driven industry. Formula: (Employees Left / Average Number of Employees) × 100.
Charts and Visualizations
StyleBI's visualization library, including charts, gauges, and heatmaps, transforms these KPIs into digestible visuals. The CEO uses the following chart types for effective monitoring:
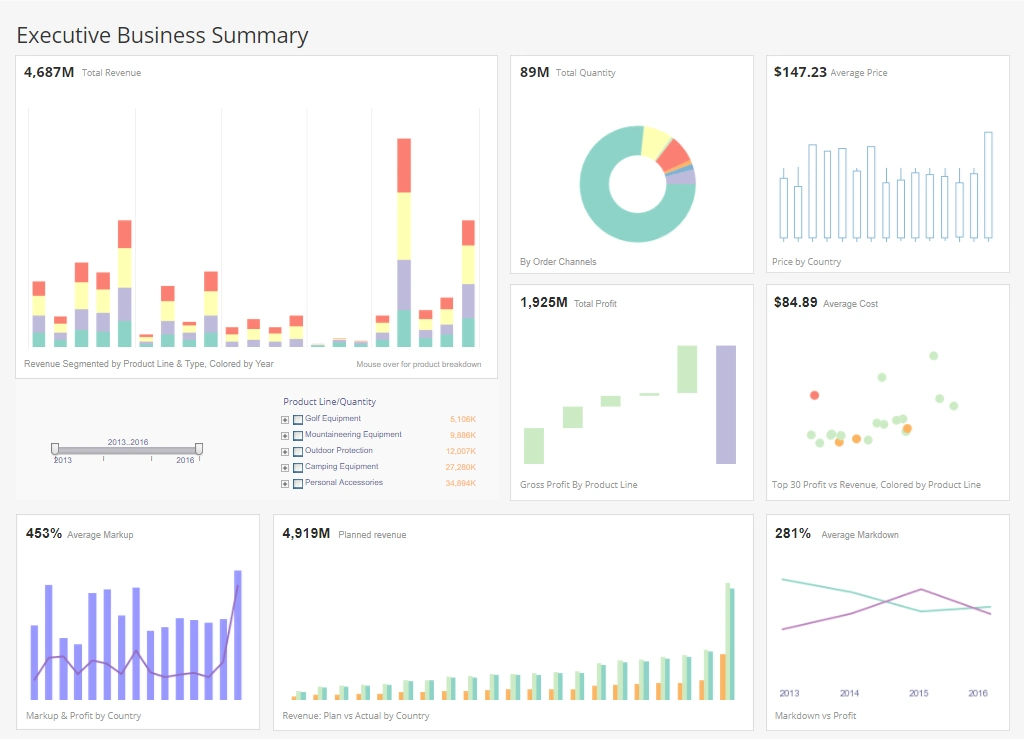
- Line Charts for Revenue Growth and ARR Trends: Line charts display revenue growth over time, helping the CEO identify seasonal trends or sales spikes tied to marketing campaigns. For example, a line chart might show a surge in vest sales during winter months when protective gear is in demand.
- Bar Charts for Profit Margin and Lead Conversion: Bar charts compare profit margins across product lines (e.g., tactical vests vs. cooling vests) or conversion rates across marketing channels (e.g., social media vs. email campaigns), highlighting top performers.
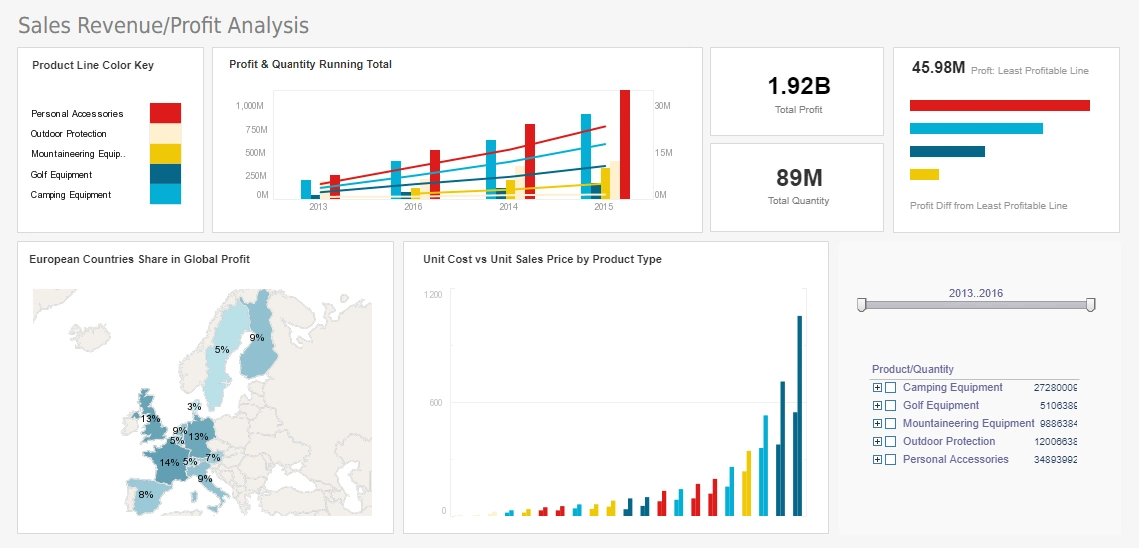
- Pie Charts for Customer Retention and ARPP: Pie charts break down customer retention by segment (e.g., pet owners vs. K9 trainers) or ARPP by product category, providing a clear view of revenue distribution.
- Heatmaps for Supplier Compliance: Interactive heatmaps visualize supplier performance across regions or product types, helping the CEO pinpoint unreliable suppliers for renegotiation or replacement.
- Gauge Charts for Order Accuracy: Gauges display order accuracy as a percentage, offering a quick snapshot of operational reliability. A gauge showing 95%+ accuracy reassures the CEO of quality control.
- Table Charts for Cash Flow and Inventory Turnover: Tables provide precise numerical data on cash flow and inventory turnover, allowing the CEO to monitor liquidity and stock efficiency.
- Area Charts for Total Profit/Loss: Area charts visualize profit trends against expenses, helping the CEO assess financial stability over time.
Analytics for Strategic Insights
StyleBI's analytics capabilities enable the CEO to go beyond static KPIs, using predictive and drill-down tools to drive proactive decisions:
- Trend Analysis: The CEO uses StyleBI's trend analysis to forecast demand for canine vests based on historical sales data, identifying seasonal patterns or emerging preferences (e.g., eco-friendly materials). This informs inventory planning and marketing strategies.
- Drill-Down Analytics: Interactive dashboards allow the CEO to explore KPIs in depth. For example, clicking on a low customer retention rate might reveal dissatisfaction with vest durability, prompting quality improvements.
- Predictive Analytics: StyleBI's AI-driven insights predict future revenue or customer churn based on current trends, helping the CEO anticipate market shifts or adjust pricing strategies.
- Data Mashup: By integrating data from ERP systems, CRM platforms, and market analytics, the CEO creates comprehensive reports comparing internal performance with industry benchmarks, ensuring competitive positioning.
Practical Use in Daily Operations
The CEO relies on StyleBI's mobile-optimized dashboards to monitor KPIs during travel or meetings, ensuring real-time oversight. For instance, during a supplier negotiation, the CEO can access a heatmap of supplier compliance to push for better terms. In board meetings, customized dashboards with branded visuals present revenue growth and CLV in polished formats, securing stakeholder buy-in. The self-service reporting feature allows the CEO to adjust KPIs or create new reports, such as analyzing the impact of a new vest line, without IT support.
Customization and Security
StyleBI's customization ensures dashboards align with the company's branding, using consistent colors and logos for professional reporting. Role-based security restricts sensitive KPIs (e.g., profit margins) to the CEO, ensuring compliance with data privacy standards.
About InetSoft's Dashboard Application
InetSoft's dashboard software is 100% Java code, web-based, and allows data mashup across domains and multiple data sources. End-users get visually compelling, highly interactive access to data that is easily manipulated by a self-service environment that requires minimal training.
InetSoft's dashboard software uses a visualization-driven approach to enable rapid deployment of self-service business. Dashboards can be easily understood so that CEOs can act quickly and efficiently on day to day operations as well as long term business objectives. They provide business users with an intuitive monitoring and analytic environment resulting in enhanced business performance, using the information stored within their performance management system.
Within an executive dashboard, statistics and data for the company as a whole can be closely monitored by the people who need to know.
Reasons to Evaluate InetSoft
Easy to use
- Enjoy a rapid implementation; minimum specialized IT expertise required
- Scale up with zero-client
deployment and no per-user licensing
- Point and click, self-service environment
- Zero client workspace
Dynamic
- Conforms to changing information and business needs
- Data exploration through visualization, rather than spreadsheets
- Runs on a high performance and a secure infrastructure
-Adapts to organizations of all sizes
Turns data into action
- Spot trends and patterns to stay competitive
- Analyses let CEOs know when and what type of action to take
- Attractive and real time charts help keep up with moving customers and markets
- KPI's and alerts can be set to measure decisions and strategies

Business Dashboarding
A CEO dashboard is a 'must have' business intelligence tool. Just as a car dashboard lets drivers know they need gas, or how fast they are going before they get pulled over, a CEO dashboard alerts C-level employees and decision makers alike of potential problems plus optimal solutions, emerging trends and patterns in the market, or even effective strategies and when to deploy them.
A CEO dashboard provides insights that were once not available through reading long reports or spreadsheets. Now, CEO's can quickly explore the data they need and make the most informed and effective decisions based on real time facts. Crucial and relevant data is presented on InetSoft's dashboard in a way that is attractive and easy to understand and manipulate. This allows executives to optimize business in a way that is suitable to them and their organization.