Why Choose StyleBI as a Modern Alternative to Freeboard?
Freeboard used to be the go-to lightweight dashboard for quick IoT and real-time monitoring projects. Its simplicity and open-source nature made sense ten years ago. Today it feels stuck: minimal chart options, almost no data transformation features, poor mobile support, and virtually no meaningful updates since the mid-2010s.
StyleBI (InetSoft) delivers a completely different experience — modern, capable, and still approachable. Here are the concrete reasons people and teams are moving away from Freeboard and choosing StyleBI instead.


1. Actually Modern Web Architecture
Freeboard runs entirely in the browser with a static JSON file. That means:
- no server-side processing
- no real security model
- painful multi-source data handling
- terrible experience on phones and tablets
StyleBI is a proper web application:
- fully responsive layouts that work well on every screen size
- central server deployment (easy scaling, updates, backups)
- server-side data mashup and caching
- real authentication & role-based permissions
- optimized real-time refresh without killing the browser
2. Visualization Quality You Can Actually Present
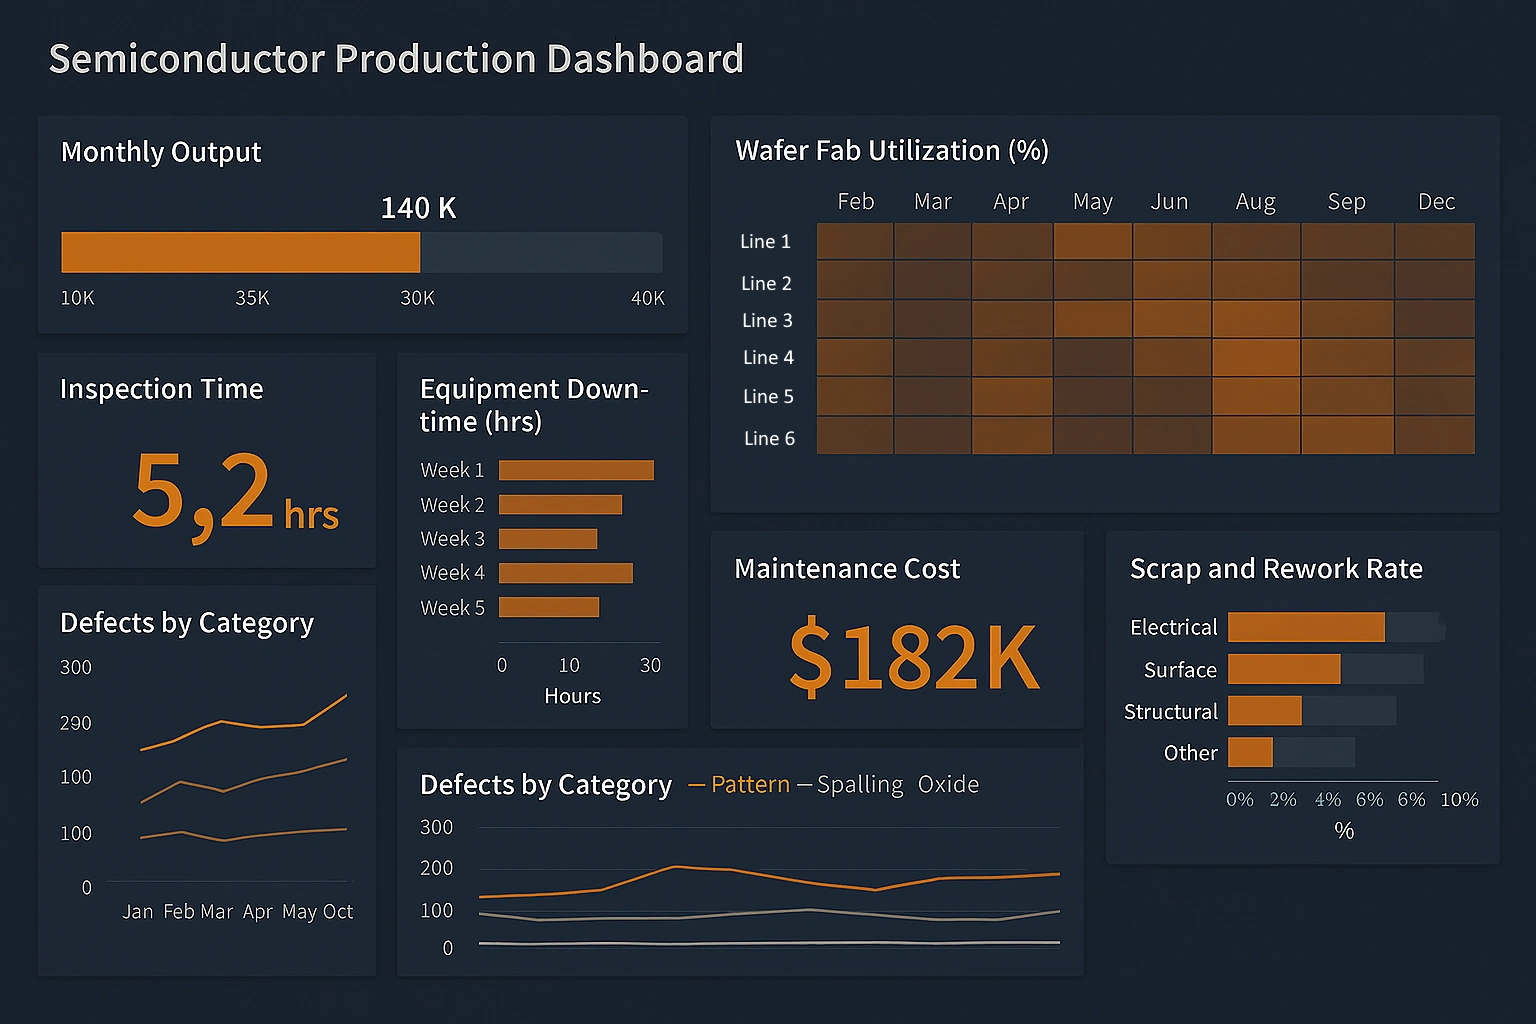
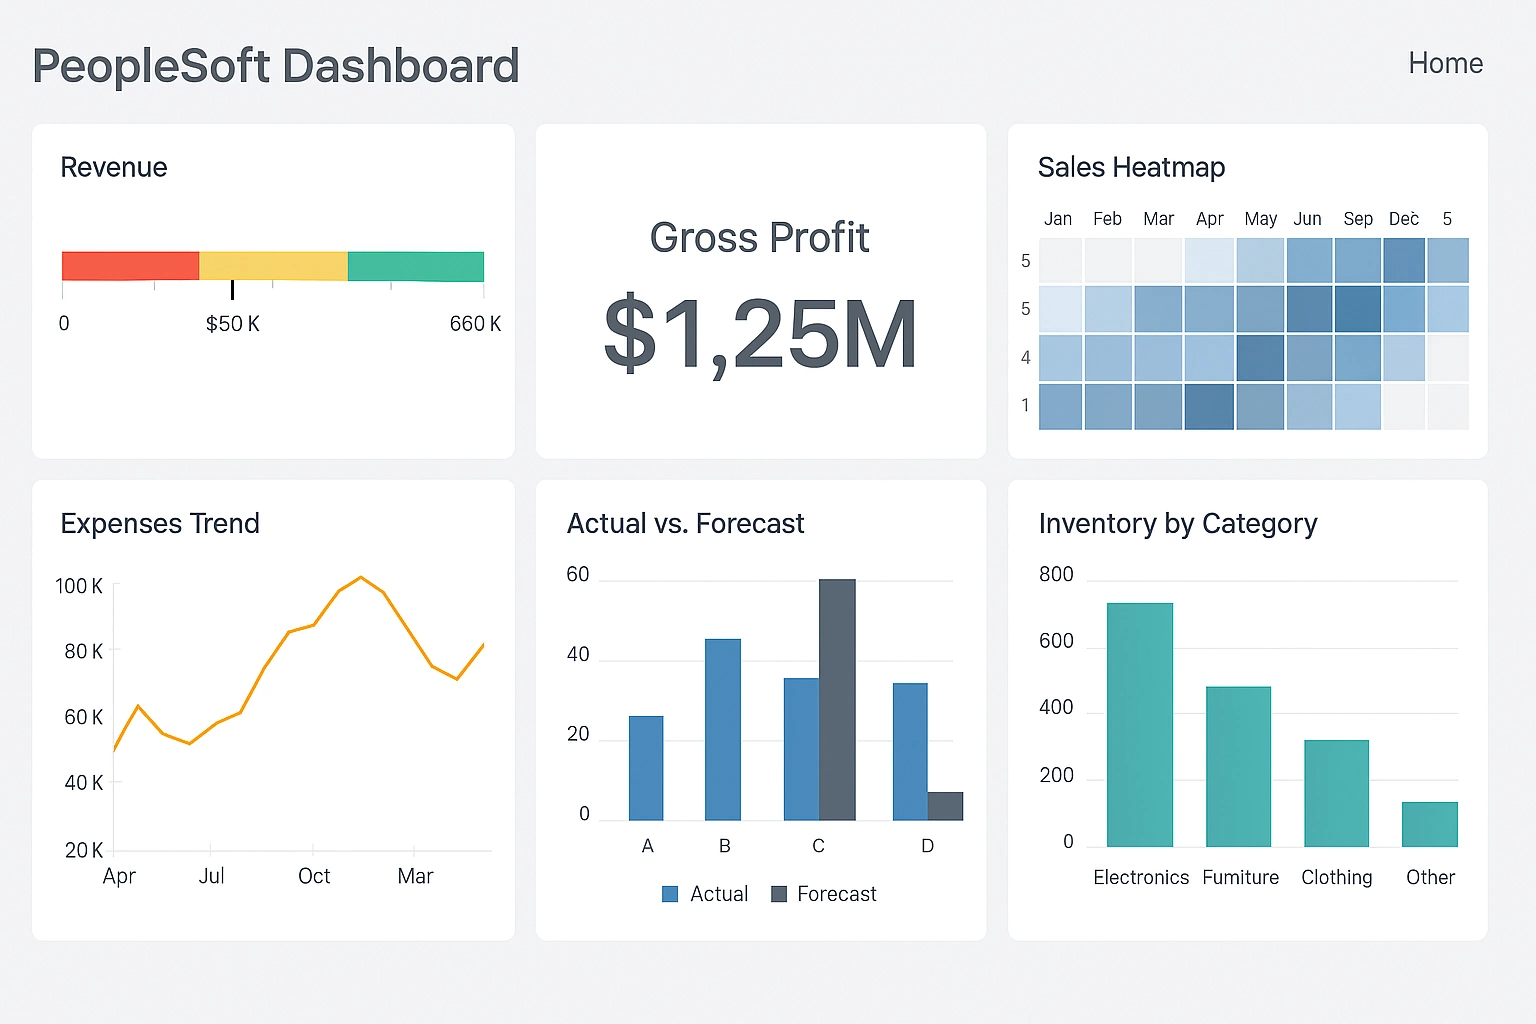
Freeboard gives you a handful of basic gauges, line charts, and text boxes. StyleBI offers a professional toolkit:
- dozens of chart types including heatmaps, treemaps, bullet charts, Sankey, radar, funnel
- clean interactive drill-down, cross-filtering, and brushing
- calculated fields, running totals, percent-of, ranking without writing SQL
- pixel-perfect layout control and theme consistency
Dashboards built in StyleBI routinely get used in executive briefings and customer-facing portals. Freeboard dashboards almost never do.
3. Data Sources — Freeboard Is Painfully Limited
If your project outgrows a single MQTT/JSON feed, Freeboard becomes a dead end fast. StyleBI grows with you.
4. Usable by Business People, Not Just Developers
Freeboard customization usually means editing JSON by hand or writing custom plugins. StyleBI gives two clear paths:
- Business users: point-and-click, natural language filters, auto-suggestions
- Analysts/developers: expression editor, JavaScript extensions, custom calculations
Most organizations report that non-technical team members can create and maintain useful dashboards within days — something almost impossible with Freeboard.
5. Features You Need When the Project Gets Serious
- Secure sharing with row-level security & column-level security
- Dashboard scheduling + PDF/email reports
- Alerts and threshold notifications
- Version history and restore
- Embed options (iframe, public links, authenticated portals)
- White-label / custom branding
These capabilities separate hobby dashboards from business-critical ones.
Bottom Line
Freeboard was great for 2012–2018 IoT tinkering. In 2026 it is limiting, outdated, and increasingly insecure.
StyleBI keeps the “no steep learning curve” philosophy while delivering:
- enterprise-grade data handling
- beautiful, presentation-ready visuals
- mobile-first design
- collaboration and governance features
- active development and support
If your dashboards are starting to matter to more people, need to combine multiple sources, or must look professional on any device — StyleBI is the practical next step.
Designing an Internet of Things Dashboard - Things to Know
This article offers practical guidance for building effective IoT dashboards. It begins by posing essential questions to clarify goals before starting development:
- What is the dashboard's primary purpose?
- Who are the intended users?
- What data sources will be involved?
The piece separates UI/UX design (visualizations, user experience) from infrastructure concerns (data processing, storage, scalability). It defines an IoT platform as an integrated hardware/software system responsible for device management, data collection, storage, visualization, and analysis.
While many IoT platforms come with built-in dashboards, some are little more than visualization front-ends. The article contrasts fully custom (DIY) solutions—which demand deep technical expertise—with ready-to-use off-the-shelf platforms that enable faster deployment and greater modularity.
Key recommendation: Carefully evaluate whether a pre-assembled ecosystem will get you to market faster, or if a custom architecture (despite added complexity) better suits long-term needs. The article strongly advocates bringing your own advanced analytics layer to deliver premium dashboards, rich reporting, and deeper insights.

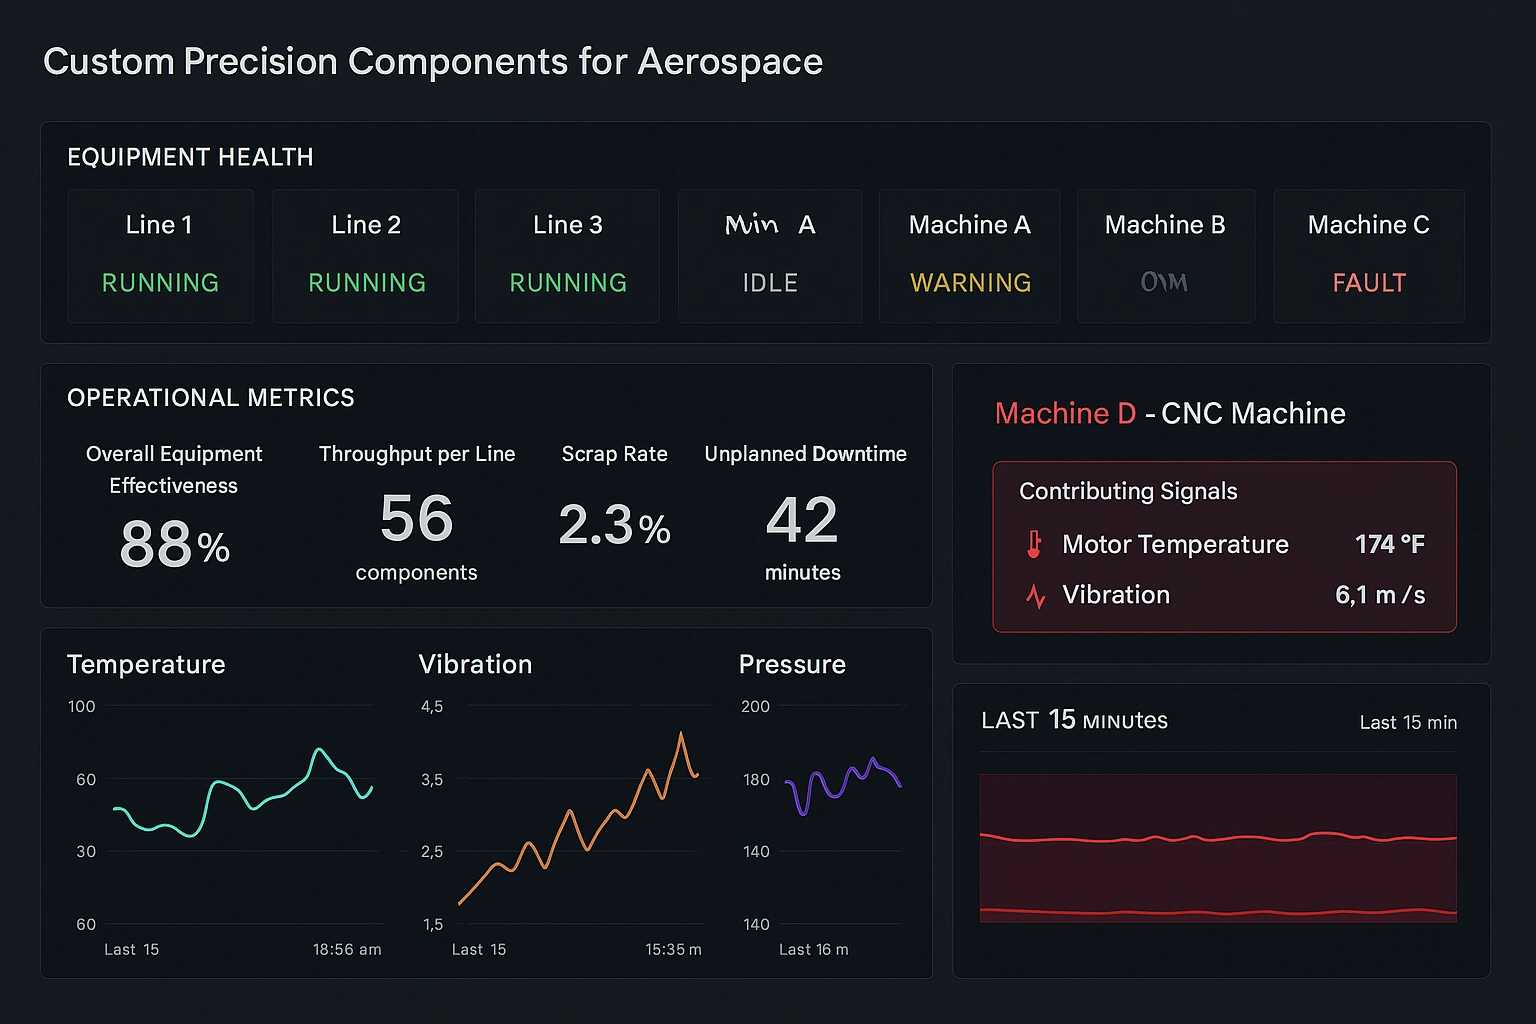
InetSoft highlights its StyleBI platform as an excellent choice for this purpose. StyleBI features a drag-and-drop designer, supports real-time IoT data visualization, combines data from multiple sources (data mashups), and delivers fully responsive, interactive web-based dashboards ideal for monitoring connected devices with charts, gauges, and more.
The discussion also addresses frequent mistakes, such as underestimating the technical complexity of IoT (far more demanding than typical web applications) and scalability issues that arise with custom solutions as usage grows. It advises selecting flexible, adaptable platforms that support deep customization without interfering with core device operations, allowing seamless integration with external analytics, reporting, or CRM systems.
In summary, the article promotes thoughtful, user-focused IoT dashboard design and positions InetSoft’s BI software as a powerful, agile solution for managing sensor streams, real-time feeds, and enterprise-grade visualization requirements.
This content is especially valuable for teams moving beyond simple tools like Freeboard toward more professional, scalable IoT monitoring solutions.
Read the full article here:
Designing an Internet of Things Dashboard - Things to Know