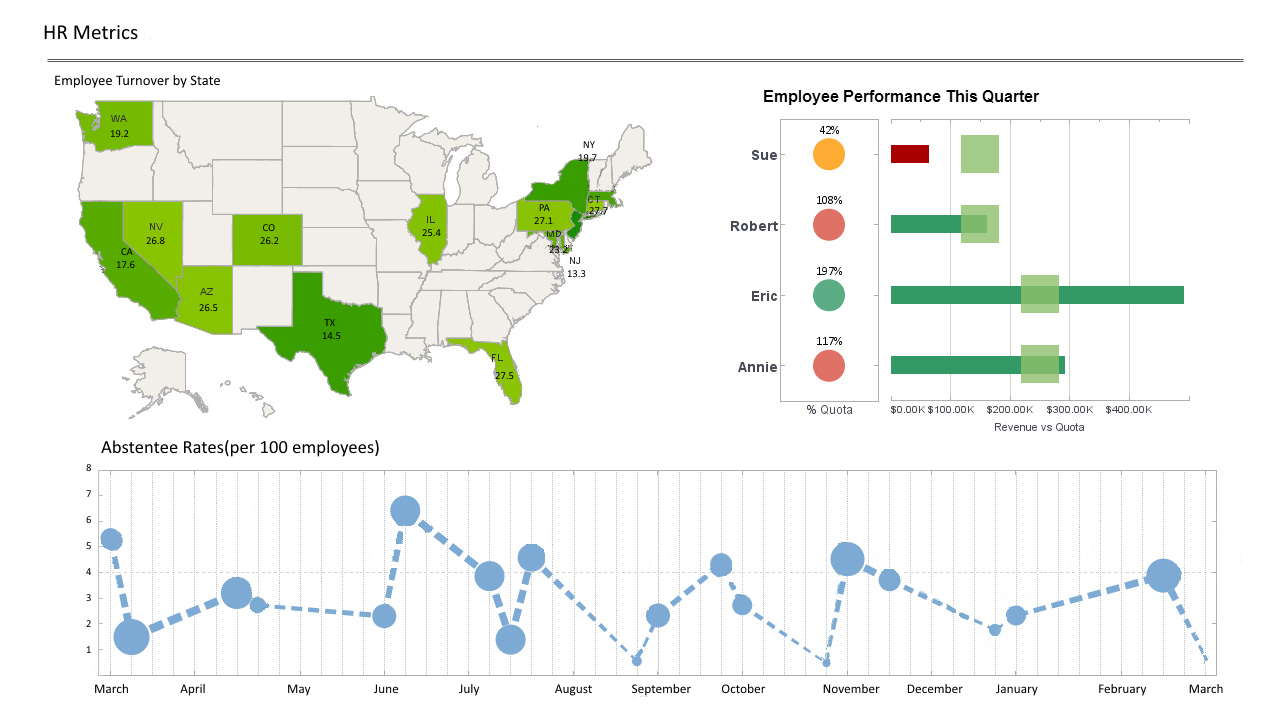
Evaluate InetSoft's Dashboarding Solution
Are you looking for a dashboarding solution that is visualization-driven and offers strong self-service functions? InetSoft's dashboarding solution is an easy-to-use, intuitive application that allows end-users to monitor, explore, and analyze and drilldown into details.
InetSoft's award-winning dashboard application is Easy, Agile, and Robust:
Easy- Enjoy a rapid implementation; minimum specialized IT expertise required
- Experience a shallow learning curve for business users; only Excel-level skills needed
- Make it easy for analysts & administrators; no SQL experience required
- Scale up with zero-client deployment and no per-user licensing
- Provide maximum self-service through ad hoc and visualization analysis
- Enable self-service also at data level: end-user defined data mashup
- Accommodate quick, formal, and experimental changes
- Address advanced and mass needs
- Run on a high performance, secure infrastructure
How a Safety Goggle Manufacturer Leverages InetSoft’s StyleBI for Operational Excellence
For one global safety goggle manufacturer, the implementation of InetSoft’s StyleBI dashboarding solution became a turning point in streamlining production, optimizing supply chains, and improving sales outcomes across multiple regions.
Background and Digital Transformation Goals
Specializing in industrial and laboratory-grade eye protection, the manufacturer operates several factories across North America and Europe. The company saw an opportunity to digitize its KPI monitoring and performance analytics, replacing its siloed spreadsheets with a cohesive, interactive reporting platform. The IT team sought a business intelligence tool that allowed custom dashboard development, data integration from ERP and MES systems, and role-based access to insights from C-level executives down to floor supervisors.
Why InetSoft’s StyleBI?
InetSoft’s StyleBI was chosen for its microservices architecture, flexible data mashup capability, and interactive chart design—all critical for integrating production, logistics, and sales metrics. The drag-and-drop dashboard builder allowed the IT department to create custom views for supply chain managers, operations analysts, and customer service teams without extensive development cycles.
Core KPIs Monitored
From safety compliance to throughput efficiency, the company defined over 40 key performance indicators, grouped into six primary domains:
- Production Efficiency: Units produced per hour, machine uptime %, defect rates
- Inventory Management: Days of inventory on hand (DOH), stockout frequency, reorder lead time
- Sales Performance: Regional sales targets, order fulfillment rate, product returns by SKU
- Quality Assurance: Non-conformance reports (NCRs), complaint resolution cycle time, audit pass rate
- Supply Chain: On-time supplier delivery %, freight cost per unit, customs clearance lead time
- Safety Metrics: PPE compliance rate, incident frequency rate (IFR), near-miss reporting count
Notable Dashboards and Chart Types
Using StyleBI’s intuitive layout tools and data blending features, the IT team delivered several high-visibility dashboards:
1. Factory Floor Dashboard
- Gantt Chart: Real-time visualization of machine scheduling and downtime events
- Thermometer Gauge: Hourly production output vs. target thresholds
- Waterfall Chart: Cumulative yield losses by defect category
2. Executive Sales Overview
- Multi-axis Line Chart: Monthly sales revenue vs. units sold and margin percentage
- Heat Map: Performance by sales territory and channel partner
- Funnel Chart: Opportunity pipeline from inquiry to close by region
3. Safety Compliance Monitor
- Bullet Graph: Site-wise PPE compliance rates compared to benchmarks
- Column Chart with Drill-down: Incident frequency by facility, department, and shift
- KPI Card Set: Live tracking of OSHA recordables, training completion %, and near-miss reports
4. Supplier Performance Tracker
- Radar Chart: Vendor scorecards across delivery, cost, and defect metrics
- Pivot Table: PO cycle times grouped by supplier and product type
- Stacked Area Chart: Monthly freight costs by logistics provider
Interactive Features and Analytics
Every dashboard incorporates StyleBI’s real-time filters and drill-down actions. For instance, supply chain managers can click on a delayed shipment to view root-cause analysis, including customs delays or supplier stock issues. Meanwhile, sales managers explore lost opportunities by region and export directly to PowerPoint for monthly review meetings.
The IT team also uses StyleBI’s advanced analytics to forecast demand spikes using historical seasonality and external variables like construction index trends. StyleBI’s integrated scripting layer allows for custom formula creation, such as a dynamic “Cost of Poor Quality (COPQ)” calculation blending defect costs, rework labor, and customer complaints.
Role-Specific Dashboards and Data Security
StyleBI’s fine-grained access controls let the company deploy dashboards tailored by role:
- Operators: Machine OEE dashboards and real-time alerts for stoppages
- QA Technicians: Defect Pareto charts and audit tracking by product line
- Procurement: Supplier lead time dashboards with trend alerts
- Executives: Mobile-friendly KPI dashboards with summary cards
Data lineage and permission rules are enforced through LDAP integration and row-level security built into StyleBI’s backend. This means warehouse staff only see data for their location, while directors can compare global metrics across the entire enterprise.
Impact Achieved
Within six months of deployment, the safety goggle manufacturer reported measurable improvements:
- 18% reduction in average supplier lead times due to performance tracking
- 12% increase in hourly output by reducing unplanned downtime
- 23% fewer customer returns through root cause analysis and design tweaks
- Full compliance with weekly safety training and PPE protocols across all sites
Most notably, the executive team praised the solution’s responsiveness during a product recall. The StyleBI dashboard allowed the company to isolate the affected batches, map customer shipments, and coordinate proactive outreach in under 48 hours—averting a major reputational risk.

