Embedded Charts for Easy Integration
InetSoft provides a chart and data access engine that ISV's or SaaS providers can use to embed charts in their applications.
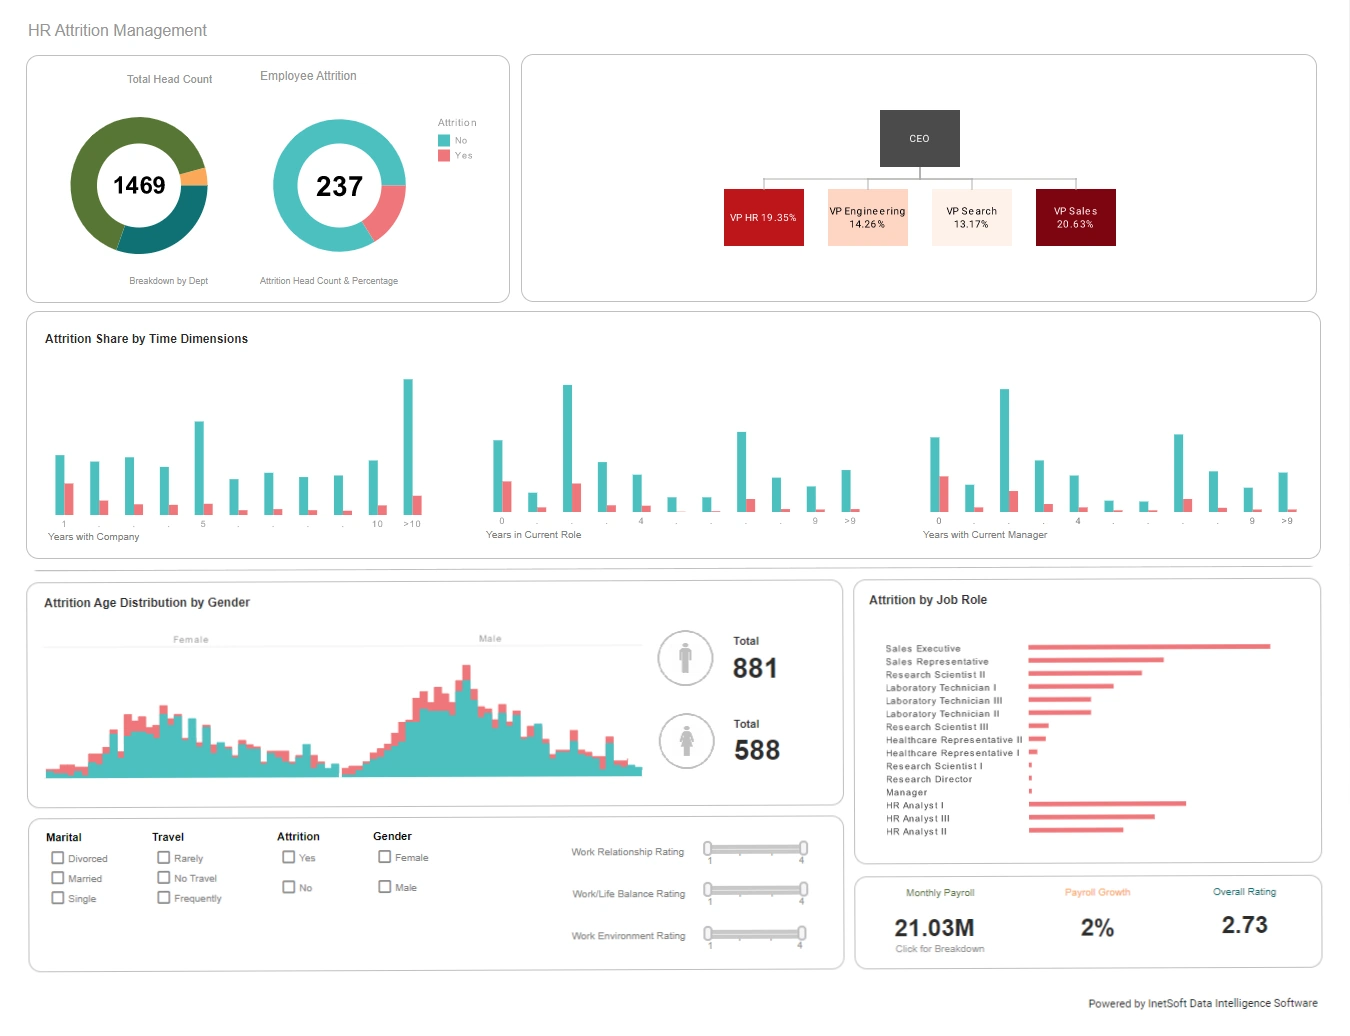
InetSoft's embeddable charts provide:
- a visually compelling charts and graphs that will appeal to all users
- a high level of interactivity and self-service for new chart creation
- intuitive controls such as list boxes and drop-downs which minimize training
- high levels of self-service with the ability to slice and dice many views of the data
- quick response for chart refreshing and drawing

For an ISV or SaaS provider, InetSoft's software provides:
- a charting solution than can scale from small to large numbers of users
- flexibility to adapt to changing data structures or information needs
- ability to mash up disparate data sources
- rapid chart and graph development
- high re-use of chart and graph components
- a drag and drop designer
- a JavaScript API that is quick to learn
- many integration points including user management
- a highly customizable solution ideal for re-branding, tailoring to the target market
- flexible licensing options that can match any business model
What Are the Options for Embedding a Chart Using StyleBI?
Style BI is a business intelligence platform that enables users to create interactive dashboards and reports. One of the key features of Style BI is its ability to embed charts and dashboards into various applications and websites. In this article, we will explore the options available for embedding charts using Style BI.
Why Embed Charts?
Embedding charts and dashboards can enhance the user experience by providing real-time insights and analytics within the application or website. This can lead to better decision-making, improved productivity, and enhanced customer engagement. Style BI offers several options for embedding charts, each with its own advantages and use cases.
Options for Embedding Charts
1. iframe Embedding
One of the simplest ways to embed Style BI charts is by using an iframe. This involves copying the iframe code from the Style BI dashboard and pasting it into the HTML code of the application or website.
<iframe src="https://stylebi.example.com/dashboard/iframe" width="100%" height="500" frameborder="0"></iframe>This method is easy to implement and works well for simple use cases. However, it may not offer the level of customization and interactivity that some users require.
2. JavaScript API
Style BI provides a JavaScript API that allows developers to embed charts and dashboards into web applications. This API offers a high degree of customization and interactivity, making it suitable for complex use cases.
To use the JavaScript API, developers need to include the Style BI JavaScript library in their application and then use the API to render the chart or dashboard.
var dashboard = new StyleBI.Dashboard({
          container: "dashboard-container",
          dashboardId: "dashboard-id",
          serverUrl: "https://stylebi.example.com",
          renderMode: "viewer"
        });
3. REST API
Style BI also provides a REST API that allows developers to access charts and dashboards programmatically. This API can be used to embed charts into applications and websites, as well as to automate tasks and workflows.
To use the REST API, developers need to make HTTP requests to the Style BI server, specifying the chart or dashboard ID, as well as any other required parameters.
GET https://stylebi.example.com/api/dashboards/dashboard-id HTTP/1.1
        Authorization: Bearer access-token
4. Single Sign-On (SSO)
Style BI supports single sign-on (SSO), which allows users to access embedded charts and dashboards without having to log in separately. This can enhance the user experience and improve security.
To implement SSO, developers need to configure the Style BI server to use an SSO provider, such as Active Directory or OAuth. They can then use the Style BI API to authenticate users and authorize access to charts and dashboards.
5. Custom Development
For complex use cases or custom requirements, Style BI offers a range of customization options, including custom themes, layouts, and visualizations. Developers can use these options to create bespoke embedded chart solutions that meet specific business needs.
Benefits of Embedding Charts
Embedding charts and dashboards using Style BI offers several benefits, including:
- Improved user experience: Embedded charts and dashboards provide real-time insights and analytics within the application or website, enhancing the user experience and improving productivity.
- Increased adoption: By embedding charts and dashboards into existing applications and workflows, organizations can increase adoption and drive business outcomes.
- Customization and flexibility: Style BI's embedding options offer a high degree of customization and flexibility, allowing developers to tailor the solution to specific business needs.
- Security and governance: Style BI's embedding options support security and governance features, such as SSO and role-based access control, to ensure that sensitive data is protected.
Best Practices for Embedding Charts
When embedding charts and dashboards using Style BI, developers should follow best practices to ensure a successful implementation. These include:
- Plan for scalability: Ensure that the embedding solution can scale to meet the needs of a growing user base.
- Optimize performance: Optimize the performance of the embedded charts and dashboards to ensure fast load times and responsive interactions.
- Test thoroughly: Test the embedded charts and dashboards thoroughly to ensure that they work as expected in different scenarios and use cases.
- Monitor and analyze: Monitor and analyze usage and performance metrics to identify areas for improvement and optimize the solution.