InetSoft Offers Embedded Dashboard Software That Is Easily Deployed and Used
InetSoft provides a dashboard application that is well-suited for another ISV or SaaS provider to use for embedding dashboards into their own applications.
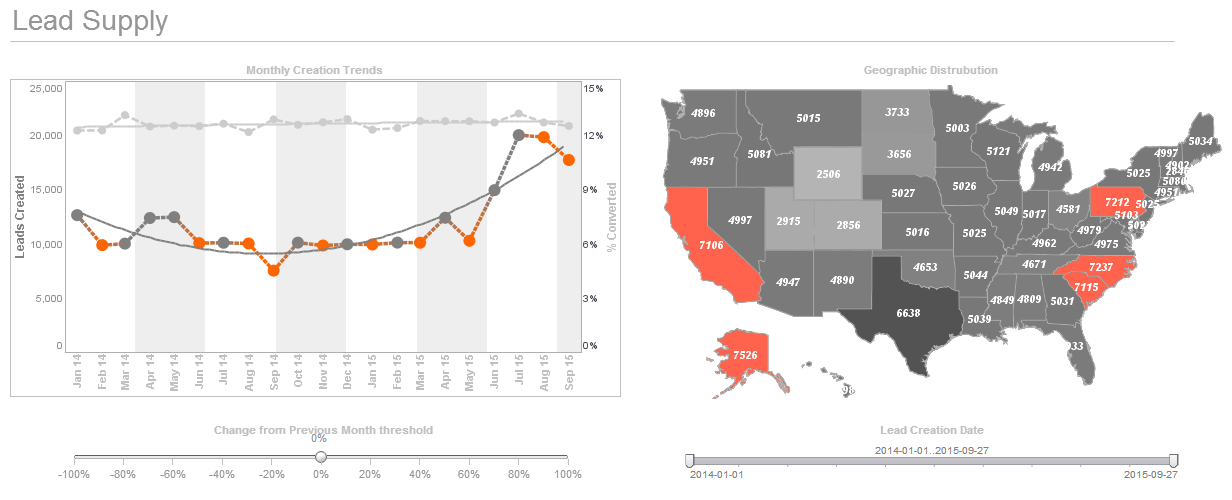
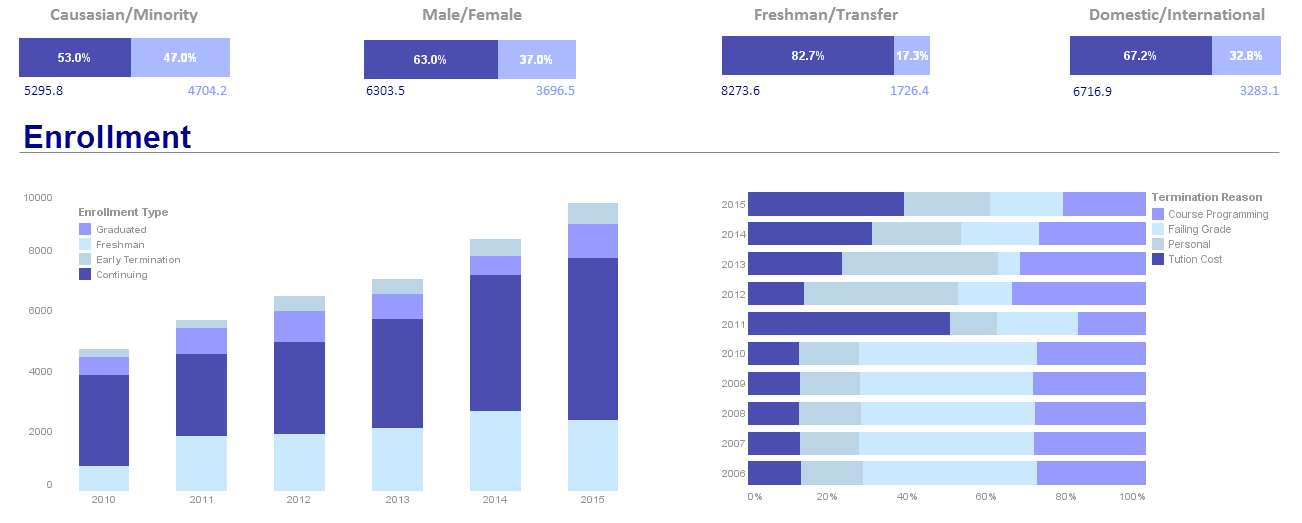
With InetSoft's embeddable dashboard solution, it is possible to provide a condensed, single screen dashboard for monitoring several key performance indicators, or whatever data needs to be presented.
InetSoft's dashboard software offers a solution provider's customers:
- A visually compelling interface that will appeal to all users
- A high level of interactivity and self-service
- Intuitive controls such as list boxes and drop-downs which minimize training
- High levels of self-service with the ability to slice and dice many views of the data
- Quick response for information display
It offers a solution provider's development team:
- A solution than can scale from small to large numbers of users
- Flexibility to adapt to changing data structures or information needs
- Ability to mash up disparate data sources
- Rapid dashboard and report development
- High re-use of dashboard and report components
- A drag and drop designer
- A JavaScript API that is quick to learn
- Many integration points including user management
- A highly customizable solution ideal for re-branding, tailoring to the target market
- Flexible licensing options that can match any business model
StyleBI from InetSoft, the solution to your application's dashboarding needs.


Embedding InetSoft’s StyleBI Microservice in a Music Website: A Developer’s Guide
Music streaming platforms and content-focused music websites need to analyze listener preferences, track artist performance, optimize recommendations, and understand regional trends in real-time. Embedding InetSoft's StyleBI microservice into your music platform can provide advanced analytics capabilities without the complexity of building a BI infrastructure from scratch.
This article walks through how to embed StyleBI into a music website, its technical advantages, and best practices for integrating interactive dashboards and analytics seamlessly within your web stack.
What is StyleBI?
InetSoft's StyleBI is a lightweight, microservice-based BI and analytics engine designed for embeddability. Unlike traditional BI platforms that are monolithic and resource-intensive, StyleBI follows a modern microservice architecture that makes it highly scalable and developer-friendly. It can be deployed as a containerized service and easily integrated into existing web applications via REST APIs and iFrames.
Its main capabilities include:
- Ad hoc reporting and dashboards
- Embedded visualizations
- Advanced analytics (predictive, statistical)
- Role-based access and multi-tenant data security
- Integration with diverse data sources (SQL, NoSQL, REST APIs)
Use Case: A Music Website
Let's say you operate a music streaming website like SoundPulse, featuring curated playlists, artist pages, user accounts, and real-time music streaming. You want to offer both internal analytics (for admins and artists) and external-facing metrics (for label partners, press kits, or even fans). Examples include:
- Real-time stream counts
- Heatmaps of regional engagement
- Audience demographics
- Revenue analytics per artist
- Drop-off points in songs or playlists
- Device/browser usage trends
Embedding StyleBI dashboards allows developers to build all this into their platform with minimal development overhead while giving business teams and creators robust analytics.
Architecture Overview
Here's a simplified view of how StyleBI fits into your architecture:
text
CopyEdit
+---------------------------+ +-------------------------+
| Music Website (UI) | <----> | StyleBI Microservice |
+---------------------------+ +-------------------------+
| ^ ^
| | |
v | |
User Actions | |
| v |
+-----> API Gateway <------------> Backend + Database
- The website communicates with your backend to authenticate users.
- StyleBI runs as a standalone service, either in the same cloud environment or in a containerized instance.
- The UI embeds StyleBI dashboards via iFrame or REST integration, showing data securely and contextually.
Step-by-Step Integration
1. Install StyleBI
InetSoft provides a Docker-based deployment for StyleBI. You can get started with:
bash
CopyEdit
docker run -d -p 8080:8080 inetsoft/stylebi:latest
Ensure it has access to your analytics database, which could be Postgres, MySQL, or even REST API-fed datasets.
2. Connect Data Sources
In the StyleBI admin interface:
- Navigate to Data Connections.
- Choose your source (e.g., MySQL, MongoDB, REST API).
- Configure a secure connection to your music dataset, including streaming logs, user data, artist profiles, etc.
For example, a REST API for fetching daily stream counts might look like:
json
CopyEdit
GET /api/streams/daily?artistId=12345
Authorization: Bearer <token>
3. Create Dashboards
Use StyleBI's visual dashboard builder to create reusable views. For example:
- Artist Performance Dashboard
- Bullet charts: Stream goals vs actuals
- Heatmaps: Listener geography
- Time-series line charts: Daily streams
- Radar charts: Genre popularity across artists
- User Engagement Dashboard
- Bar charts: Skips vs. completes
- Tables: Active sessions per device type
- Funnel charts: Playlist starts to completions
Once published, each dashboard is assigned a View ID, which you can use for embedding.
4. Embed Dashboards in Your Web App
You can embed dashboards using an iFrame with secure session tokens.
Example React component:
jsx
CopyEdit
<iframe
src={`https://analytics.soundpulse.com/stylebi/embed/${dashboardId}?token=${userToken}`}
width="100%"
height="800"
frameBorder="0"
/>
Or, for finer control, use StyleBI's JavaScript SDK to dynamically load views and react to filters.
javascript
CopyEdit
StyleBI.init({
container: "#dashboard-container",
viewId: "artist-performance",
token: userToken,
filters: {
artistId: currentArtistId,
},
});
Authentication & Security
Use your app's SSO or token-based authentication to generate access tokens for StyleBI. It supports:
- JWT token authentication
- Role-based access control (RBAC)
- Row-level security (RLS)
This ensures that an artist sees only their data, and admin users see aggregate views.
Example token payload:
json
CopyEdit
{
"sub": "user123",
"roles": ["artist"],
"filters": {
"artistId": "12345"
},
"exp": 1710000000
}
Pass this token via header or URL param when loading the dashboard.
Advanced Features Developers Will Appreciate
1. Parameter Injection
Filter dashboards at runtime based on user context:
jsx
CopyEdit
<iframe
src={`.../embed/viewId?artistId=${artistId}®ion=${region}`}
/>
2. REST API Control
Programmatically export dashboards as PDF or images for use in press kits or partner reports:
bash
CopyEdit
GET /api/v1/views/{viewId}/export/pdf
Authorization: Bearer <token>
3. White-Labeling
StyleBI allows CSS and theme customizations, letting you blend dashboards into your app UI for a seamless look.
css
CopyEdit
/* Customize dashboard themes */
.stylebi-header {
background-color: #0f172a;
color: #f8fafc;
}
4. Multi-Tenant Support
Ideal if your platform hosts multiple labels, agencies, or artist collectives—each can get isolated, tenant-specific data views.
Performance Considerations
- Caching: Use StyleBI's built-in caching engine to avoid querying the same data repeatedly.
- Data Aggregation: Pre-aggregate data tables (e.g., hourly instead of raw log entries) to improve load times.
- Load Balancing: Use horizontal scaling or a cloud load balancer if embedding into high-traffic dashboards.
