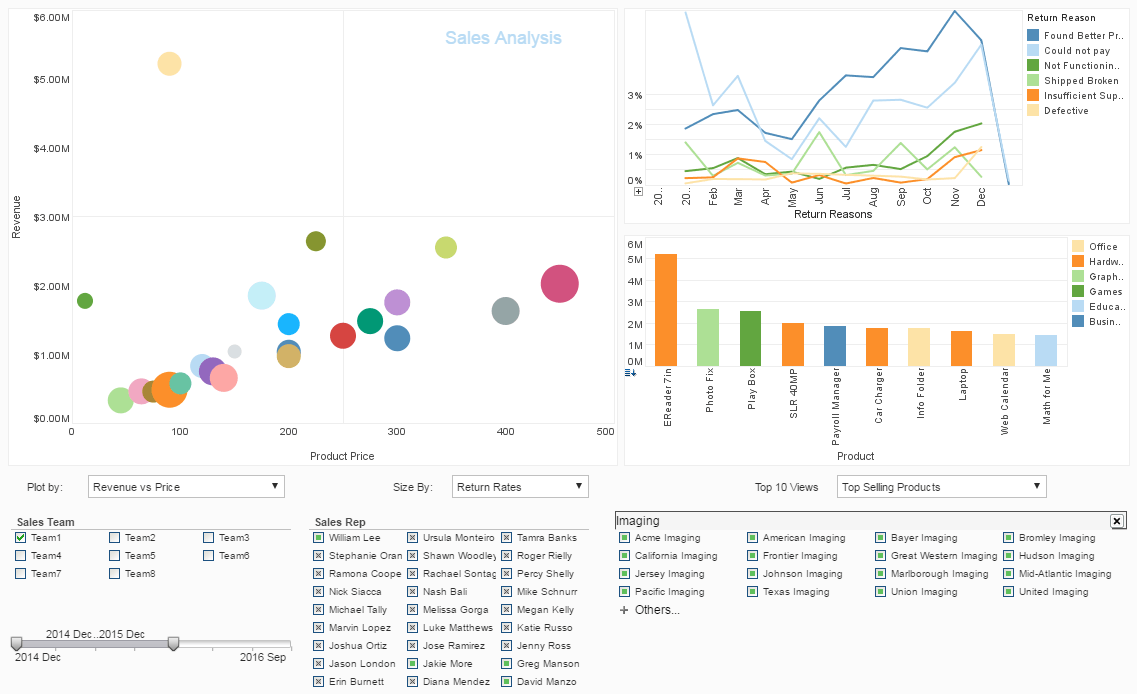
A Provider of Ecommerce Software Uses StyleBI to Embed Graphs
Data is the lifeblood of any successful online store. Merchants are inundated with metrics, from conversion rates and customer lifetime value to inventory turnover and marketing ROI. However, raw data is often just noise—a deluge of numbers and spreadsheets that can be overwhelming and difficult to translate into actionable insights. The true challenge lies not in collecting data, but in understanding it. This is where OmniShop, a forward-thinking ecommerce software provider, is changing the game by leveraging the power of StyleBI to embed stunning, intuitive, and deeply interactive graphs directly into its platform.
OmniShop has long been recognized for its robust and user-friendly platform, catering to businesses of all sizes, from fledgling startups to established enterprises. Yet, their leadership team identified a persistent pain point among their clientele: data paralysis. Merchants had access to analytics, but the standard reports were often generic, visually uninspired, and lacked the flexibility needed to ask specific, nuanced questions about their business. The solution wasn't just more data; it was data presented with clarity, context, and style.
Enter StyleBI: More Than Just a Chart
To address this challenge, OmniShop embarked on a mission to find an embedded analytics solution that could seamlessly integrate into their existing infrastructure while offering unparalleled visualization capabilities. They found their perfect match in StyleBI, a business intelligence and data visualization tool renowned for its powerful rendering engine and developer-friendly API. Unlike traditional BI platforms that can feel clunky and disconnected when embedded, StyleBI was designed from the ground up to be a native extension of the host application.
The "Style" in StyleBI is its core differentiator. The platform offers a vast library of chart types and graphical elements, but its true power lies in its deep customization capabilities. It allows host platforms like OmniShop to create a completely bespoke analytics experience. This means the graphs and dashboards within the OmniShop admin panel don't look like a third-party add-on; they are a core, harmonious part of the user experience, adopting OmniShop's branding, fonts, and color palettes. This seamless integration fosters trust and encourages user adoption, making analytics feel less like a chore and more like a natural part of managing one's business.
Transforming the Merchant Experience with Embedded Graphs
The integration of StyleBI has fundamentally transformed how OmniShop merchants interact with their data. Instead of exporting CSV files or navigating to a separate analytics tab with static reports, they are now greeted with a dynamic and visually rich dashboard the moment they log in. Here are some of the key ways OmniShop utilizes StyleBI's embedded graphs to empower its users:
1. The Live Sales Dashboard
The centerpiece of the new analytics suite is the Live Sales Dashboard. This isn't a simple line graph updated every few hours. Powered by StyleBI's real-time data connection, it's a dynamic visualization showing sales as they happen. A world map glows in the locations where orders are being placed, while gauges for hourly sales, average order value, and conversion rate tick up in real time. This immediate feedback loop is incredibly motivating for merchants and allows them to see the instant impact of a flash sale or marketing campaign.
2. The Customer Journey Funnel
Understanding the path from visitor to loyal customer is critical. OmniShop employs a beautifully rendered Sankey diagram from StyleBI to visualize the customer journey. Merchants can see how users flow from different traffic sources (e.g., social media, organic search, paid ads), through various product pages, to the cart, and finally to a completed purchase. The graph is interactive, allowing merchants to click on any stage of the funnel to see the corresponding drop-off rates and identify potential friction points on their site.
3. Product Performance Heatmaps
Which products are true bestsellers and which are lagging? OmniShop uses StyleBI to generate an intuitive product performance heatmap. Products are represented as color-coded rectangles, with the size indicating sales volume and the color intensity representing profitability or conversion rate. This allows merchants to understand their entire product catalog's performance at a single glance. They can easily filter this graph by date range, product category, or sales channel to uncover hidden trends, such as which products sell best during specific seasons or to certain customer segments.
4. Marketing Campaign ROI Analysis
Attributing sales to the correct marketing channel is a complex but essential task. StyleBI's capabilities allow OmniShop to present marketing data in a clear, comparative bar chart. Merchants can see their spend on Google Ads, Facebook campaigns, and email marketing side-by-side with the revenue generated from each. Hovering over a specific campaign reveals more granular metrics like click-through rate, cost per acquisition, and the specific products sold. This visual clarity empowers merchants to make smarter decisions about their marketing budget, allocating funds to the channels that deliver the best returns.
The Technical Edge and Future of Ecommerce Analytics
The partnership between OmniShop and StyleBI is more than just a feature integration; it's a strategic advantage. By embedding analytics directly into their core product, OmniShop has created a stickier platform that provides immense, ongoing value to its merchants. The technical implementation ensures that these sophisticated visualizations are delivered with lightning-fast speed, without slowing down the overall performance of the merchant's admin panel.
Furthermore, the flexibility of StyleBI means that OmniShop can continue to innovate. They are already developing new modules for inventory forecasting, using predictive analytics to generate visual trend lines that help merchants avoid stockouts. Another planned feature is a customer segmentation dashboard that will use clustering algorithms to group customers into visual personas, such as "High-Value Repeat Buyers" or "Discount Seekers," allowing for more targeted marketing efforts.

