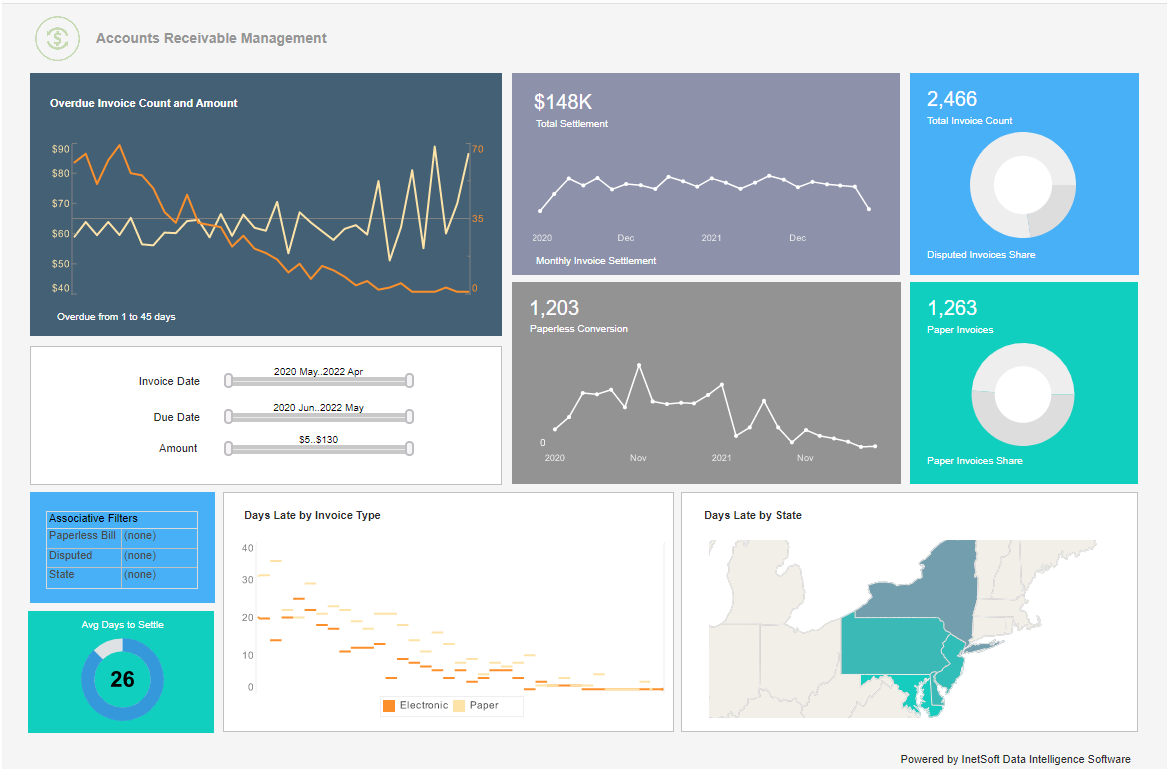
Finance Dashboards for Tracking Key Metrics
Are you looking for a financial reporting tool to track key metrics? Since 1996 InetSoft has been making BI software that is easy to deploy and use. Whether you need pdf reports of financial statements or interactive KPI metrics dashboards to monitor finance and other corporate KPIs, InetSoft's server-based application connects to almost any data source including ERP applications such as JDE or SAP, or even Excel spreadsheets. Reports can be distributed automatically, and dashboards can be used from any browser, whether from a PC or a mobile device.
A Manufacturer of Acceleration Switches Selects InetSoft for Financial Reporting Dashboards
A Manufacturer of acceleration switches, with a strong presence in the industry, has turned to InetSoft's open-source StyleBI to streamline their financial reporting and gain a deeper understanding of their key performance indicators (KPIs). In this article, we'll explore how this manufacturer leveraged StyleBI to report on crucial financial KPIs, and what these metrics reveal about their business.
The Challenge: Financial Reporting in a Complex Industry
As a leading manufacturer of acceleration switches, the company operates in a highly regulated environment, subject to stringent quality control measures and exacting customer specifications. With a diverse range of products and a global customer base, the company's financial reporting requirements are complex and multifaceted. To make informed decisions, stakeholders need access to accurate, up-to-date information on financial performance, including revenue growth, profitability, and cash flow.
The Solution: InetSoft's StyleBI
InetSoft's StyleBI is an open-source business intelligence platform designed to simplify financial reporting and analysis. With its intuitive interface and robust feature set, StyleBI enables users to easily connect to various data sources, create interactive dashboards, and share insights across the organization. The manufacturer implemented StyleBI to report on key financial KPIs, providing stakeholders with real-time visibility into their financial performance.
Financial KPIs: A Closer Look
The manufacturer tracks a range of financial KPIs using StyleBI, each providing unique insights into their business. Let's examine some of the most critical metrics and their meanings:
- Revenue Growth Rate: This KPI measures the percentage change in revenue over a specified period, typically quarterly or annually. A positive revenue growth rate indicates increasing sales, while a negative rate signals declining revenue. By tracking revenue growth, the manufacturer can assess the effectiveness of their sales strategies and identify areas for improvement.
- Gross Margin: Gross margin represents the difference between revenue and the cost of goods sold (COGS), expressed as a percentage. A higher gross margin indicates that the manufacturer is generating more profit from each sale, while a lower margin suggests that costs are eating into profitability. By monitoring gross margin, the company can optimize pricing, manage COGS, and improve overall profitability.
- Operating Expenses as a Percentage of Revenue: This KPI measures the proportion of revenue consumed by operating expenses, such as salaries, rent, and marketing costs. A lower percentage indicates that the manufacturer is managing expenses effectively, while a higher percentage suggests that costs are out of control. By tracking this metric, the company can identify areas for cost reduction and optimize their operational efficiency.
- Return on Assets (ROA): ROA measures the manufacturer's ability to generate profits from their assets, including property, equipment, and inventory. A higher ROA indicates that the company is utilizing its assets efficiently, while a lower ROA suggests that assets are not generating sufficient returns. By monitoring ROA, the manufacturer can evaluate the effectiveness of their asset management strategies.
- Days Sales Outstanding (DSO): DSO measures the average number of days it takes for the manufacturer to collect payment from customers. A lower DSO indicates that the company is managing its accounts receivable effectively, while a higher DSO suggests that cash flow may be impacted by slow-paying customers. By tracking DSO, the manufacturer can optimize their accounts receivable processes and improve cash flow.
- Cash Conversion Cycle: The cash conversion cycle measures the time it takes for the manufacturer to convert inventory into sales, collect payment from customers, and pay suppliers. A shorter cycle indicates that the company is managing its working capital efficiently, while a longer cycle suggests that cash flow may be strained. By monitoring the cash conversion cycle, the manufacturer can identify areas for improvement and optimize their supply chain management.
StyleBI in Action: Reporting on Financial KPIs
Using StyleBI, the manufacturer created interactive dashboards to report on these critical financial KPIs. The platform's intuitive interface allows users to easily drill down into detailed data, analyze trends, and identify areas for improvement. With StyleBI's robust visualization capabilities, stakeholders can quickly grasp complex financial information and make informed decisions.
The manufacturer's StyleBI implementation includes several key features:
- Real-time data updates: StyleBI connects to various data sources, ensuring that financial data is up-to-date and accurate.
- Interactive dashboards: Users can create custom dashboards to track key financial KPIs, drill down into detailed data, and analyze trends.
- Visualization tools: StyleBI's visualization capabilities enable users to create interactive charts, graphs, and tables, making complex financial data easy to understand.
- Collaboration and sharing: StyleBI allows users to share insights and reports across the organization, facilitating collaboration and informed decision-making.
The Impact: Enhanced Financial Visibility and Decision-Making
By leveraging StyleBI to report on financial KPIs, the manufacturer has gained a deeper understanding of their business and improved their decision-making capabilities. With real-time visibility into financial performance, stakeholders can:
- Identify areas for improvement: By tracking key financial KPIs, the manufacturer can pinpoint areas where costs are out of control, profitability is suffering, or cash flow is strained.
- Optimize financial performance: With StyleBI's insights, the company can adjust pricing, manage expenses, and optimize asset utilization to improve financial performance.
- Make informed decisions: By analyzing trends and detailed data, stakeholders can make informed decisions about investments, resource allocation, and strategic initiatives.

