Business Intelligence in Federal Government Agencies
Business Intelligence software is widely used throughout the federal government, both to assemble and present data, as well as to guide funding and inform strategic decisions. In most cases, business intelligence software must be able to distill massive amounts of data down to few key performance indicators (KPIs) that can be communicated to the public, to agents in the field, and to politicians charged with creating legislation.
The following sections discuss the use of business intelligence software in different federal agencies that are required to assembled and report data regarding various aspects of the economy, health and well-being, national security, and so on. In most cases the software used within government agencies for these analyses is not a matter of public disclosure, and may be proprietary in some instances, but it remains clear from public reports and dashboards that the data analysis and presentation are the results of business intelligence tools such as data mashup and transformation, charting, drilldown, interactivity, and so on.
The penetration of such tools within government agencies is expected to increase in the future as citizens come to expect greater transparency and the ability to explore data from different government data repositories using custom filters and presentation.

Department of Health & Human Services
The purpose of the Department of Health & Human Services (HHS) is to "enhance the health and well-being of all Americans, by providing for effective health and human services and by fostering sound, sustained advances in the sciences underlying medicine, public health, and social services." Over 6,000 hospitals report daily medical data to HHS, which gives this agency a uniquely cyclopedic view of the overall state of American health.
In addition to using business intelligence systems to track internal operation of the agency related to employee job function, training, etc., HHS also has unique responsibilities to convey health and wellness data to the public, and to try to encourage healthy behavior and lifestyle. Business Intelligence analysis and data presentation can be hugely influential in achieving this goal, as illustrated, for example, by the department's efforts to effectively communicate the state of Covid transmission and management on a national and local level. (See https://public-data-hub-dhhs.hub.arcgis.com/.)
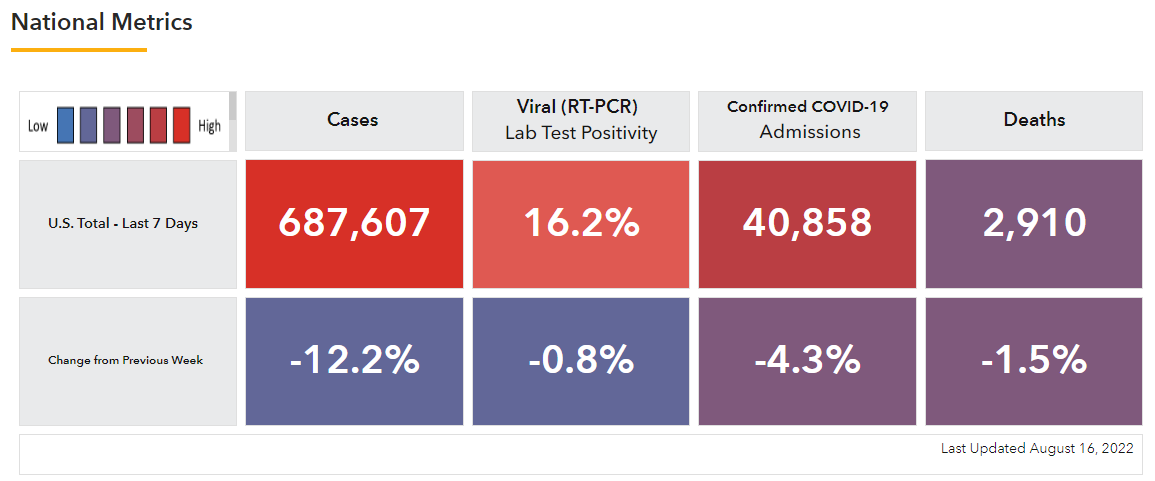
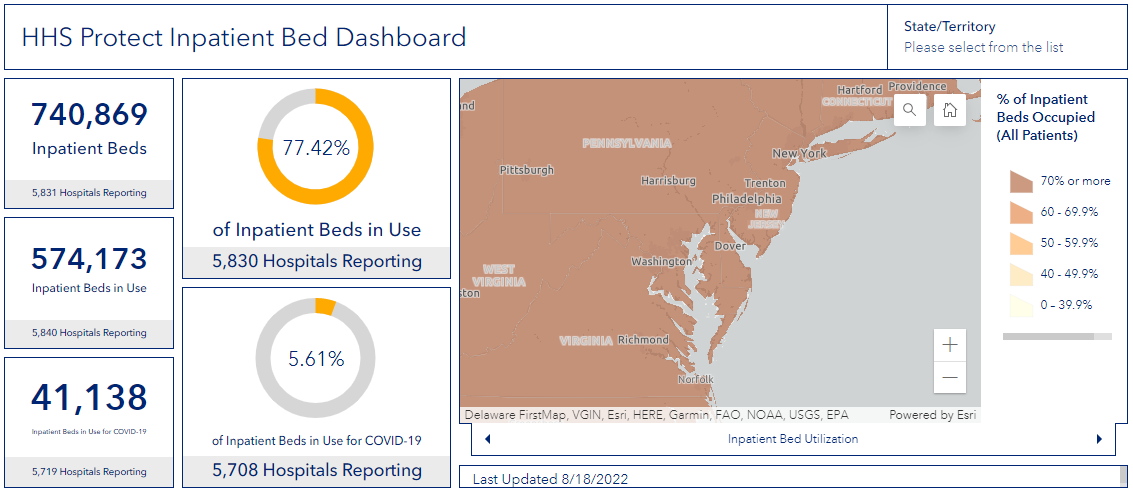
Clearly, the benefits of business intelligence are not limited only to dissemination of Covid statistics, but apply equally to presentation of all health-related information, for example, this dashboard of inpatient bed usage (https://public-data-hub-dhhs.hub.arcgis.com/pages/Hospital%20Utilization).
The effective federation of medical data is crucial in determining the presence of illness in the population, or the interaction of environment and health. It is often the case that impacts on health from environmental factors such as polluted water and air or from tainted pharmaceuticals can only be recognized when data sets are sufficiently large. Individual physicians and medical facilities can rarely perceive these effects in their own samples, but effective analysis of the country-wide data available to HHS can make such effects much easier to locate. Tools that can access and process massive health data sets are therefore essential to the mission of HHS and to the welfare of the US citizen.
Department of State
The State Department is tasked with carrying out the foreign policy of the United States as laid out by President and Congress. This requires the department to have a deep knowledge of policy and politics around the world, from foreign conflicts to matters of migration, terrorism, political unrest, natural disasters, drugs, climate, etc., and to track and analyze data from dozens of regions on an ongoing basis.
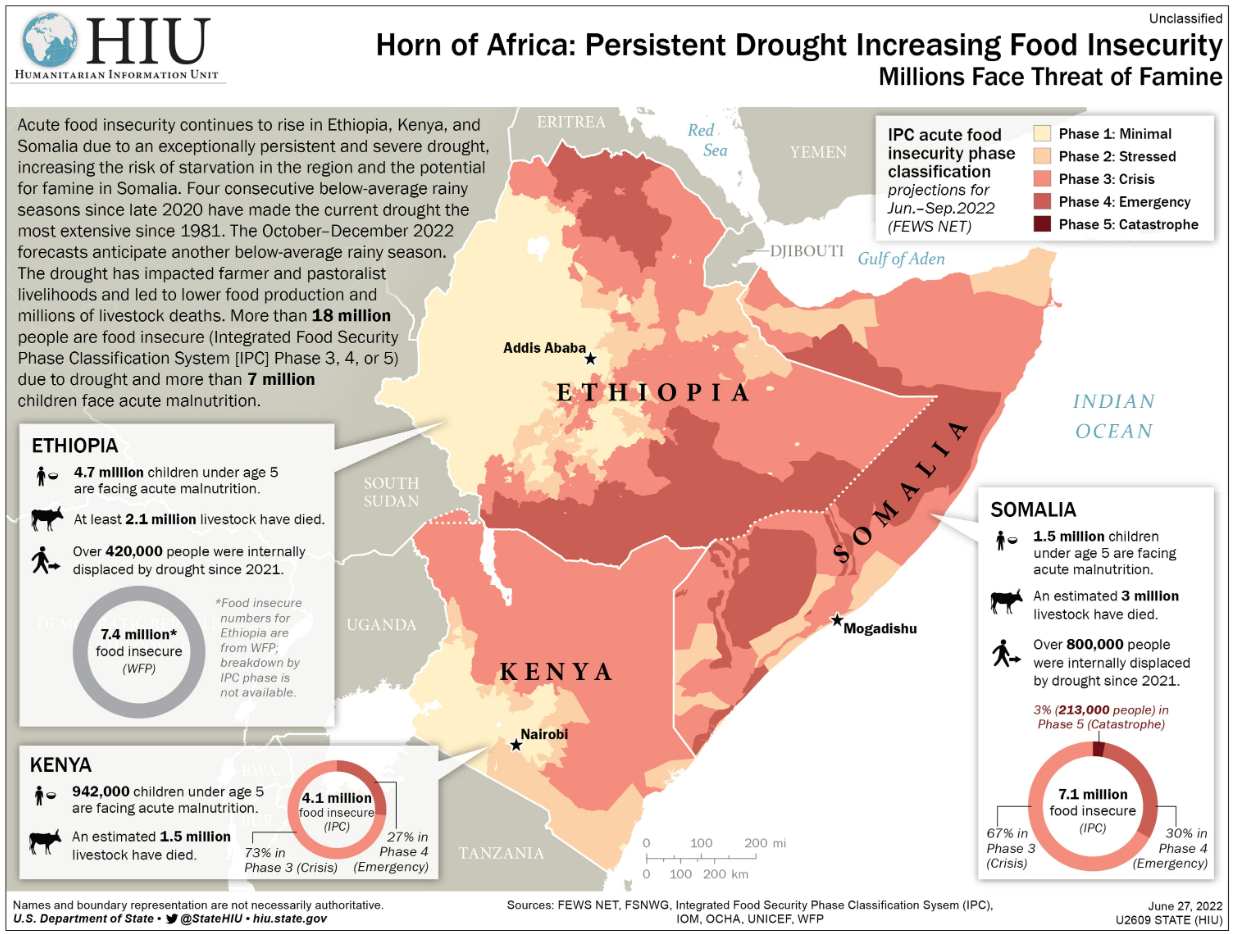
Business intelligence can help in making sense of the vast quantities of data collected by the State Department. For example, the Humanitarian Information Unit (HIU) produces reports on crisis situations around the word, such as the drought situation in Africa (https://hiu.state.gov/#AF,U2609). The graphic illustrates typical map-based business intelligence output, using color to code dimensions and measures, and inset charts and graphics (including donut charts) to highlight areas of particular interest to the reader.
In whichever area the State Department focuses its efforts, the sound analysis and presentation of data is key to forging partnerships with other nations and forming action plans that are timely and targeted to the problem that exists at the current moment, not a month or a year ago. Business intelligence software provides the tools that can facilitate the federation of diverse data sets, and the generation from meaningful insight that can drive data-based decision making.
Department of Homeland Security
The Department of Homeland Security is tasked with keeping US citizens safe, and was formed in response to the terrorist attacks of September 11. The department now addresses not only matters of potential terrorism, but also election security, border security, disaster readiness, human trafficking, and cybersecurity.
The ability of DHS to execute its mission is highly dependent on access to the most current data, and the use of tools that enable professionals at the department to extract trends and meaning from the data. Whether the matter is drugs, immigration, or violent extremism, the situations that DHS attempts to address evolve on a daily basis, and analysis must be ongoing, in order to present policy makers with the most current estimates of a situation, as well as to inform the public of matters pertaining to public safety.
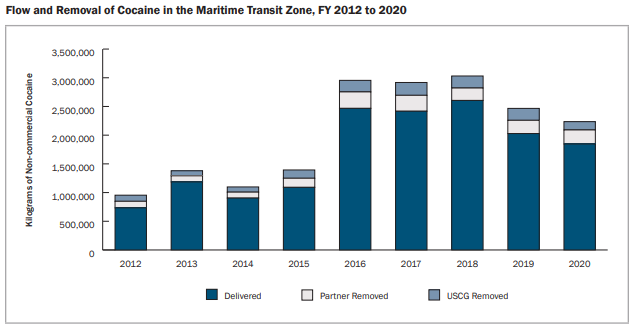
he graphic below is typical of the type of analysis DHS must produce, highlighting the growth over years of cocaine interdictions (https://www.dhs.gov/sites/default/files/2022-06/2022_0427_plcy_border_security_metrics_report_FY2021_%282020_data%29.pdf). DHS produces hundreds of such graphics pulling data from a wide variety of sources to create reports that present a coherent picture of national threat and safety.
Department of Justice
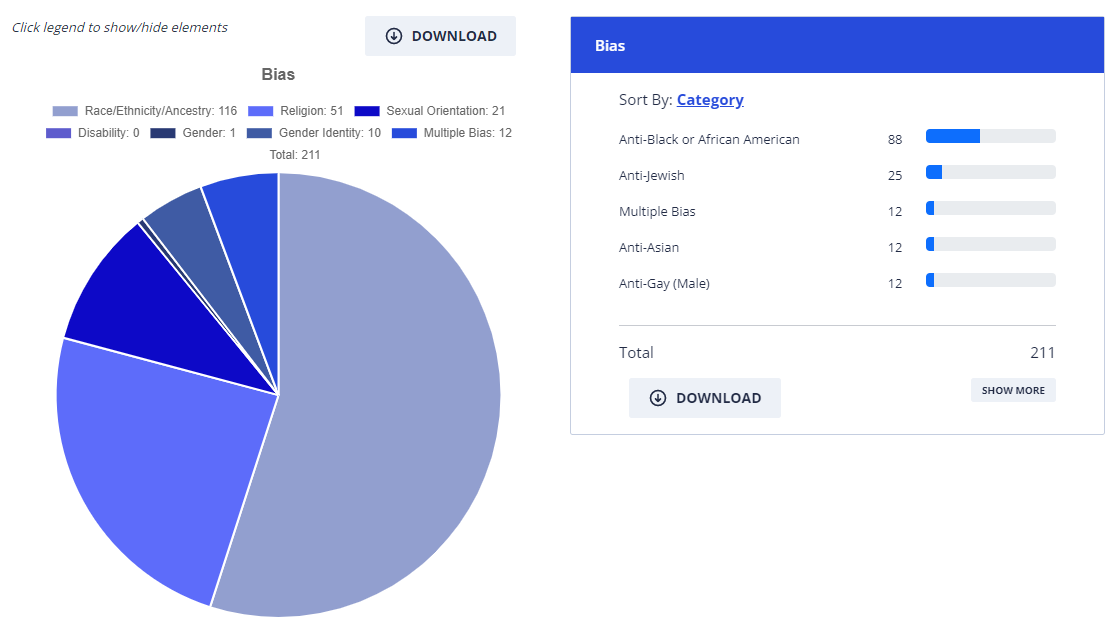
The Department of Justice (DOJ) is responsible for securing the safety of American citizens by prosecuting crime and protecting civil rights. The DOJ is comprised of many agencies that rely heavily on data analysis, such as Bureau of Alcohol, Tobacco, Firearms and Explosives (ATF), Federal Bureau of Investigation (FBI), and Drug Enforcement Administration (DEA). Business Intelligence is key to understanding patterns of crime as well as social trends such as recreational drug use or gun ownership that, while not illegal, may have widespread impacts on citizens' safety, and which have historically been attractive areas for organized crime.
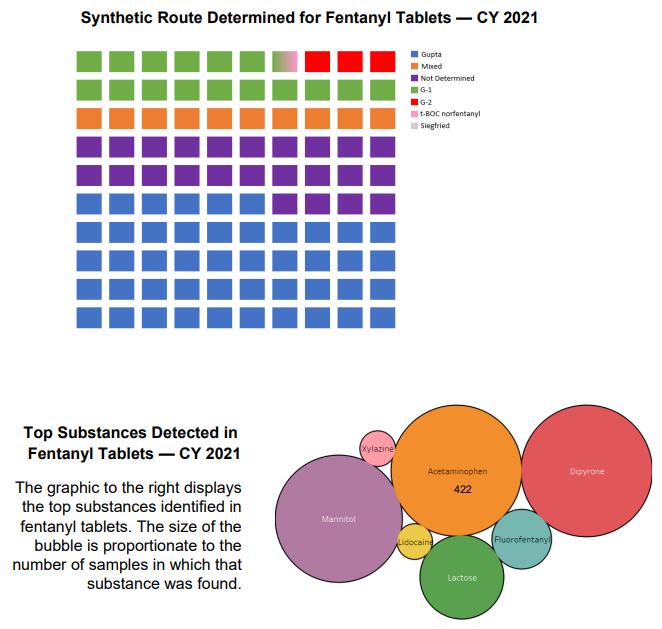
For example, DEA tracks a number of aspects related to the illicit use of fentanyl, including methods of synthesis and common additives (https://www.dea.gov/documents/2022/2022-08/2022-08-22/cy-2021-fentanyl-profiling-program-fpp). Business Intelligence analysis such as this allows the agency to stay abreast of changing pattern of drug usage, inform the public of present dangers, and strategically target enforcement actions.
Similarly, the FBI tracks vast amounts of crime data, and must transform the raw data into meaningful statistics that can inform the public and guide enforcement and prevention. A view of some of the Bureau's Business Intelligence tools is exposed to the public through the Crime Data Explorer (https://crime-data-explorer.app.cloud.gov/pages/home), which allows anyone to explore data related to various types of crimes and enforcement actions.
The ability to make sense of crime data is absolutely crucial to law enforcement agencies because failure to understand the actual modes and mechanisms of crime will inevitably lead to misguided enforcement efforts, lack of positive results, and consequent public mistrust. By understanding the actual dimensions of crime, including perpetrators, victims, locations, and severity, the agency can effectively deploy its resources in a manner that can fulfill its mission to ensure the safety of the American public.
Department of Labor
The US Department of Labor (DOL) governs many aspects of employment law, pay, benefits, and rights of workers. To fulfill its mission, the DOL must acquire and manage vast amounts of data related to employment, productivity, salaries, and so on. The Department incorporates the Bureau of Labor Statistics to help assemble and manage this data. Some business-intelligence data exploration tools are provided to the public at https://www.bls.gov/data/apps.htm, and provide a glimpse of the kind of analysis and interpretation that needs to be performed on these large data sets to present meaningful insight.
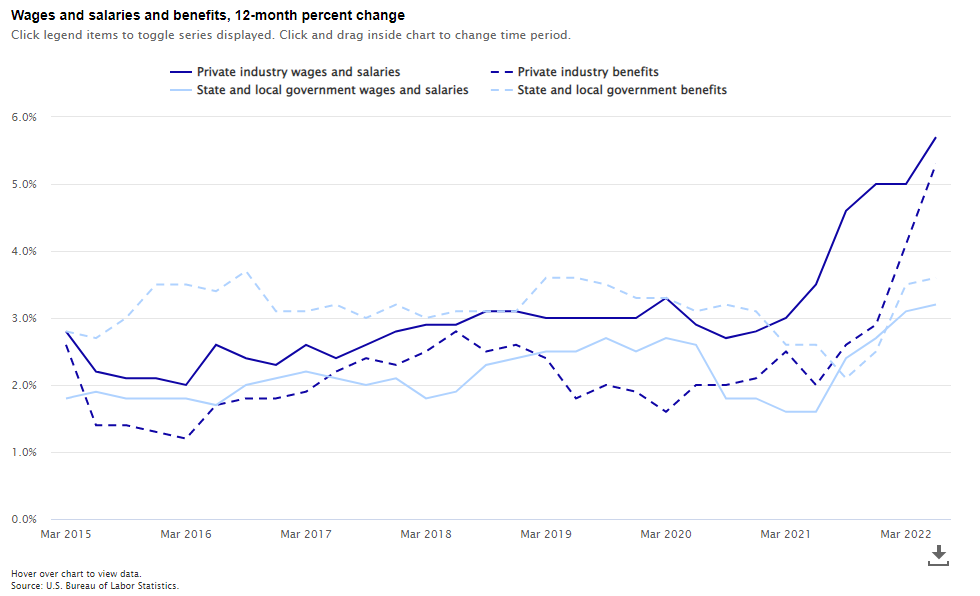
Among the information that the Department provides are facts about wages and salaries, workplace injuries, demographic breakdowns, and response of employment to natural disasters and catastrophic national events such as the COVID epidemic. To produce meaningful and informative narratives in all these areas requires powerful business intelligence tools that can analyze and process data in a variety of different ways and that can present the results in a manner that is accessible both to the public and to policy professionals.
Department of Commerce
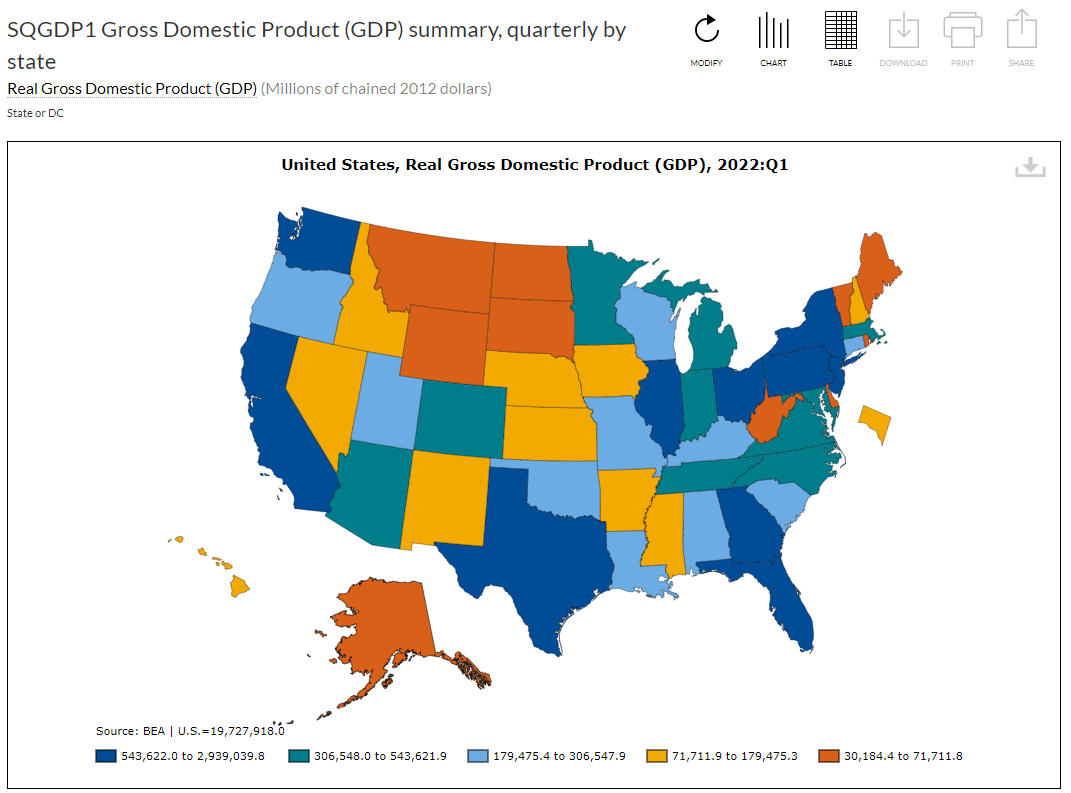
The Department of Commerce is charged with facilitating economic activity and monitoring the health of the US economy. Data is the cornerstone of economic analysis and the Department publishes an entire guide at https://www.commerce.gov/sites/default/files/2021-08/US-Dept-of-Commerce-Data-Strategy.pdf describing its data strategy. The Bureau of Economic Analysis (BEA) assembles and processes vast quantities of economic data, and provides these insights to economists, policy-makers, and the public. It provides a set of business intelligence wizards at https://apps.bea.gov/itable/index.cfm that allow anyone to slice and dice recent economic data and gain insight into the health of the economy.
Department of Transportation
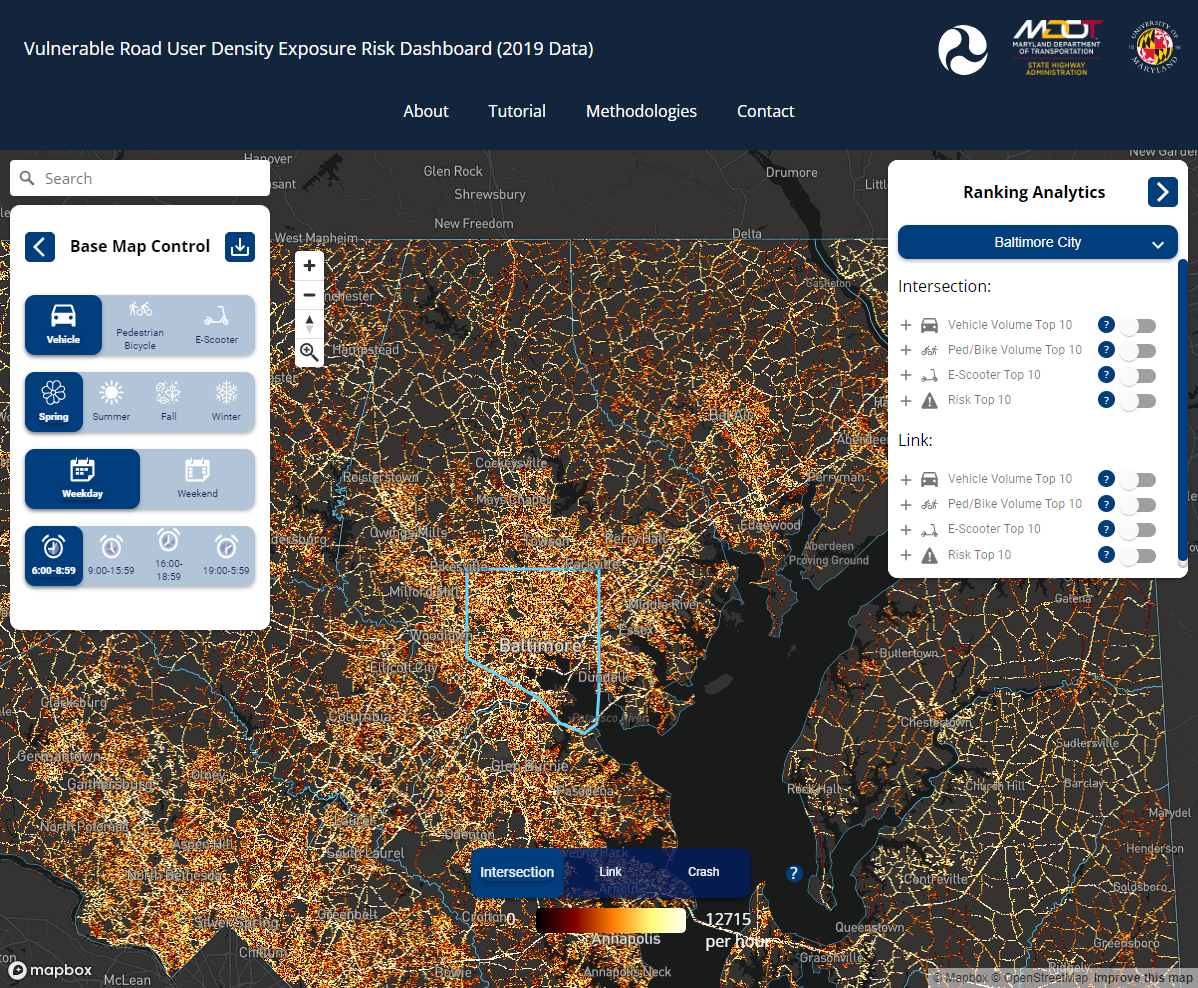
The Department of Transportation (DOT) is responsible for all concerns related to travel and travel safety within the United States. Data plays a major role in the operations of the Department, and example of which can be seen in the Safety Data Initiative, described at https://www.transportation.gov/content/safety-data-initiative. The initiative focuses on ability to "integrate existing data and new 'big data' sources", "use advanced data analytics to provide new insights into transportation safety risks", and "create data visualizations to help policymakers arrive at safety solutions." This is essentially the very purpose of business intelligence. An illustration of data projects funded by the Departments that utilize business intelligence is the Maryland Vulnerable Road User Density Exposure Risk Dashboard. This displays risk areas geographically, allowing funding to be better targeted to improving the most dangerous travel corridors.
Department of Housing and Urban Development
The Department of Housing and Urban Development (HUD) is responsible for monitoring and managing the availability of shelter, and includes a research branch called the Office of Policy Development and Research (PD&R). According to its mission statement, "PD&R is responsible for maintaining current information on housing needs, market conditions, and existing programs, as well as conducting research on priority housing and community development issues.
The Office provides reliable and objective data and analysis to help inform policy decisions." To be able to do this, the Office must able to marshal large data sets and present them in a simplified manner using Business Intelligence tools. An example of this can be seen in the housing market reports the Office produces on a regular basis (https://www.huduser.gov/portal/ushmc/hmi-update.html).
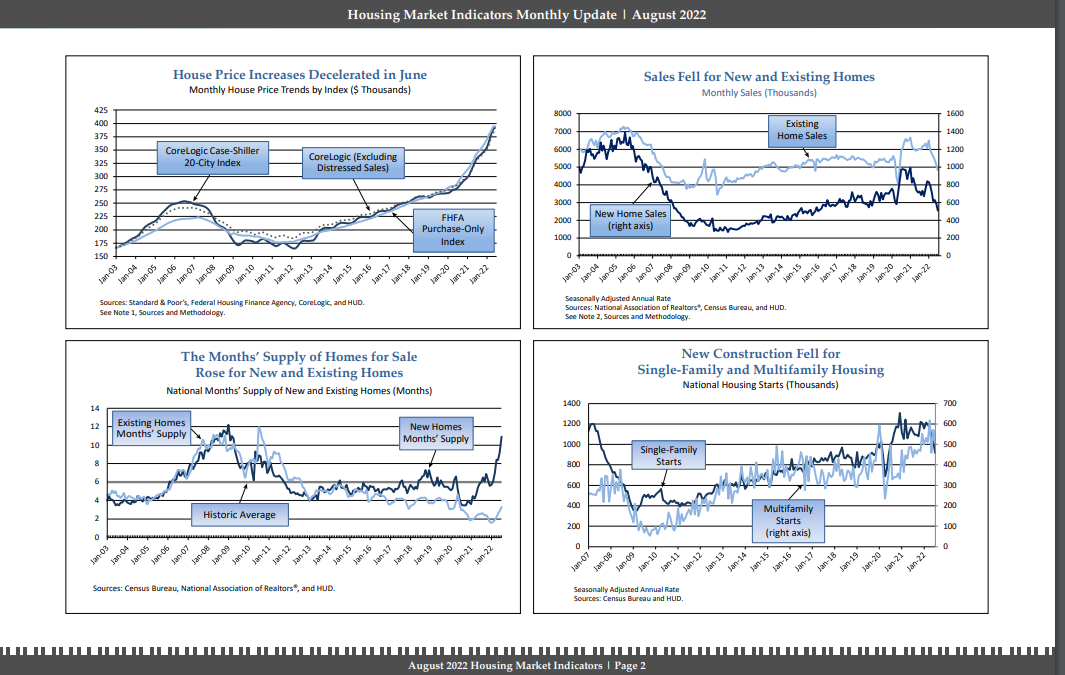
These reports, and other research presentations produced by the Office, must provide deep insight into the US housing market by distilling vast amounts of data into meaningful charts and tables that can be relied upon for crafting government policy, and which can also be useful for actors in other housing-dependent areas of the economy, such as mortgage lenders, homebuilders, hardware and lumbar suppliers, city planners, and so on.
Department of Energy
The Department of Energy (DOE) incorporates a data and information arm called the US Energy Information Administration (EIA) that assembles and presents data on a variety of areas related to energy, fuels, utilization, and so on. The data presented by the EIA can be of crucial importance to the utility sector in determining pricing, physical plant investments, hiring, and so on. For example, the analysis of current natural gas prices in relation to multi-year averages can be an important determinant of natural gas prices and may encourage producers to bring more drilling rigs online, or to idle drilling installations.
Business Intelligence tools are key to understanding the impact of various factors on energy prices, availability, and environmental impact. For example, the Office examines the many factors that determine oil prices (https://www.eia.gov/finance/markets/crudeoil/reports_presentations/crude.pdf). These types of wide ranging analyses can only be done efficiently by tools that can process massive data sets to facilitate exploration of all relevant variables.Federal Reserve
The Federal Reserve System, or the "Fed", is the central bank of the United States, and is responsible for setting monetary policy that determines lending rates and directly influences the US economy, as well as the world economy more broadly. To guide the bank's operation, the Fed needs to acquire data about the behavior of the economy to balance economic health measures such as employment against monetary concerns such as inflation.
The Fed's website provides a number of interactive visualizations (https://www.federalreserve.gov/consumerscommunities/sheddataviz.htm) that illustrate how business intelligence can be used to make sense of economic data, and paint a meaningful picture of economic trends for professionals and laypeople alike.
Summary
The US federal government is complex and its many agencies are tasked with a wide variety of duties related to data acquisition, analysis, and presentation As illustrated above, business intelligence tools such as charts, mathematical analysis, filters, dashboards, and reports are essential for these federal offices to accomplish their missions.
A number of agencies choose to provide limited Business Intelligence tools via their website to the public to explore the data collected by the agencies, while others provide the raw data sets for download. The General Services Administration (GSA) actually provides a dedicated website, www.data.gov, to serve these data sets to the public. In any case, within the agencies themselves, business intelligence tools are used to produce reports and dashboards to inform the public and other policymakers within the government.
The large datasets managed by federal agencies call for tools that can effectively connect to a variety of databases and process massive data sets in an effective manner. Although many agencies only produce reports on a periodic basis, there is no doubt that wider adoption of business intelligence software would facilitate the publication of more current data and more up-to-date analysis. It is likely that the trend to present data to the public (as well as government officials) in the form of explorable dashboards will intensify in the future as users come to expect this type of data access form their government agencies.