How to Create a Leads Summary Report
This document will explain how to create a Leads Summary Report using report creation software from InetSoft. A working version of this report can be found on the InetSoft Gallery. This report consists primarily of a single chart and a single crosstab, along with a variety of text.
Below, we will examine how you can create these different components using the browser-based Ad Hoc Reporting feature.
Contents
Two Ways to Create a Report
Create a New Ad Hoc Report
Add a Chart
Add Text
Add Scripted Content to Text
Adjust Page Setup
Summary

Two Ways to Create a Report
InetSoft provides two different tools for creating reports. The first tool, Style Studio, is a desktop application that provides a full-featured environment for creating pixel-perfect production reports and report components such as scripts, table styles, beans, and templates. This tool is well-suited for professional report developers. The second tool, the Ad Hoc Reporting app, is a browser-based tool intended for end-user report design. It offers the most commonly-used reporting features and is targeted at business users who need to rapidly create custom reports to suit immediate needs.
This document will demonstrate how you can use the Ad Hoc Reporting tool to quickly develop a Lead Summary report. All you need to start is a data source and your web browser.
Create a New Ad Hoc Report
To create a new Ad Hoc report, press the Create New button at the top of the User Portal, and select Report.
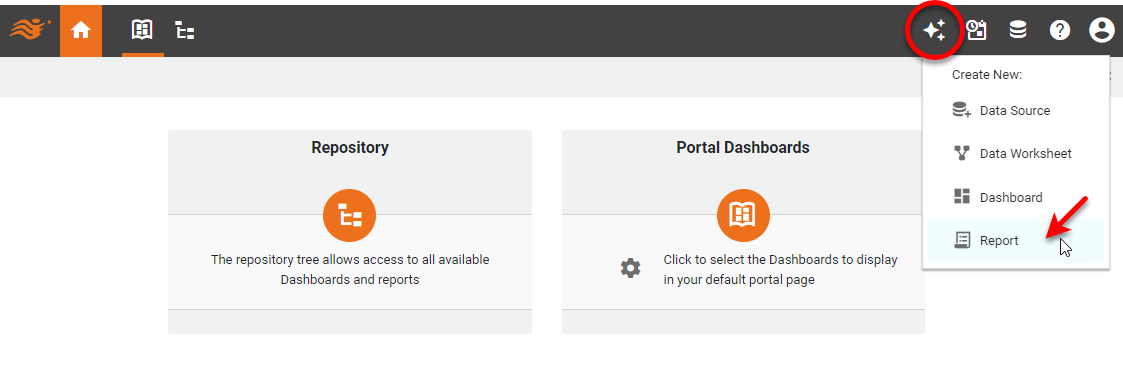
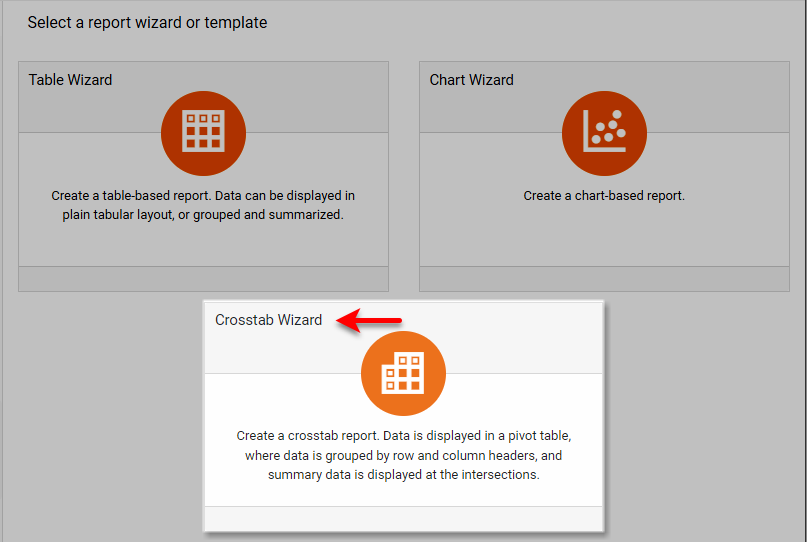
This opens the Ad Hoc Report Wizard. Since we plan to feature a Crosstab in the report, let's begin by selecting the Crosstab Wizard.
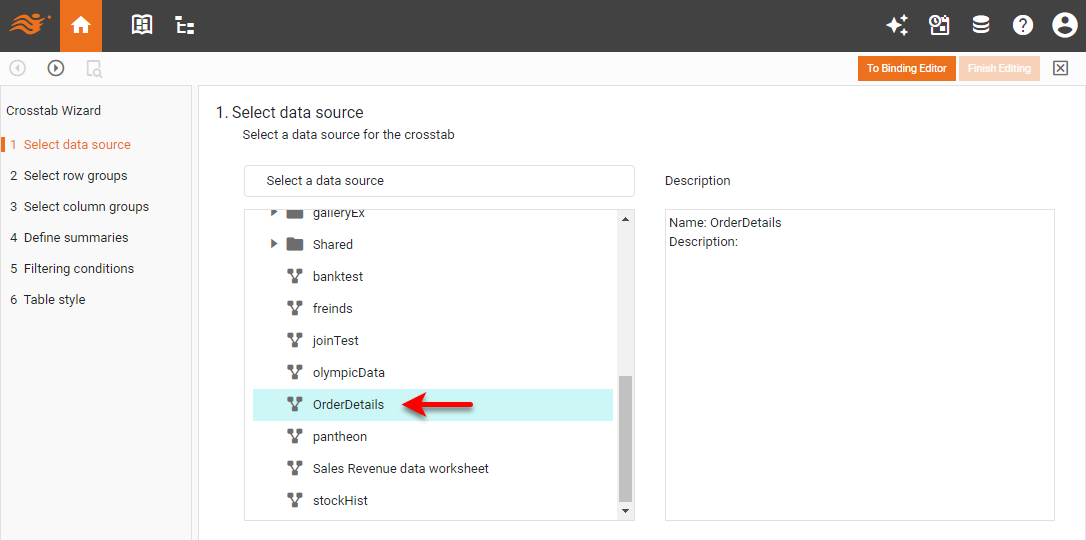
In Step 1, select the data source for the Crosstab, in this case a Data Worksheet named 'OrderDetails'. Press Next.
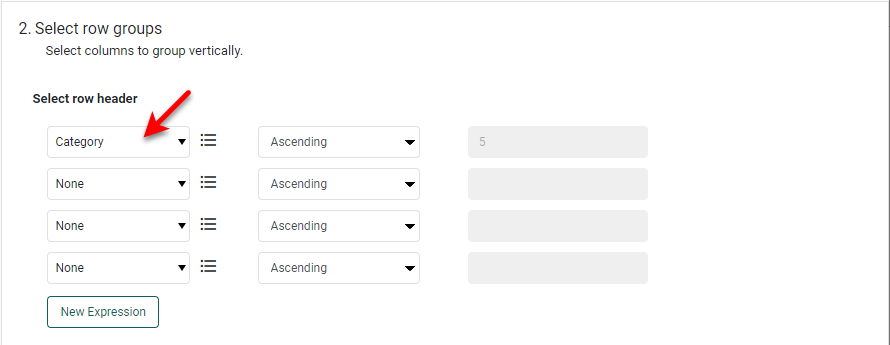
In Step 2, select 'Category' as the Row Header.
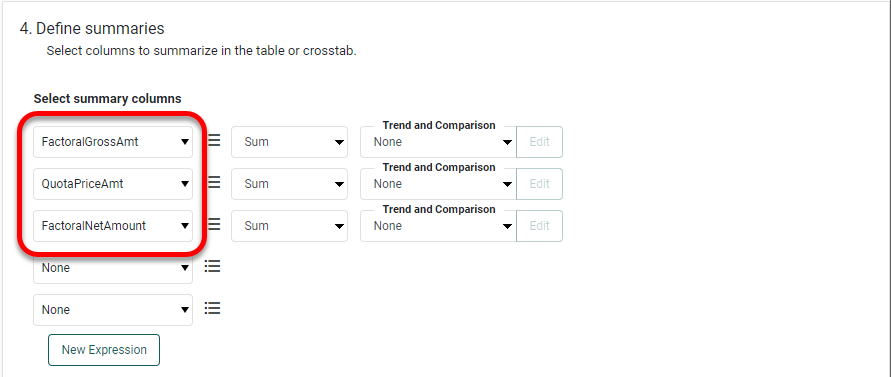
Skip Step 3. In Step 4, add the following summary columns.
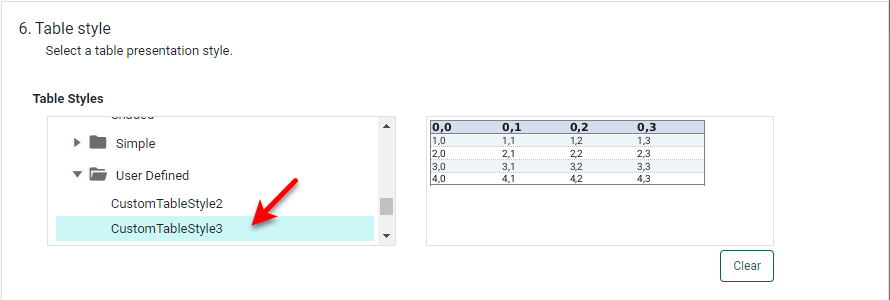
Skip Step 5. In Step 6, select a Table Style if desired. Press Finish.
Modify a Crosstab
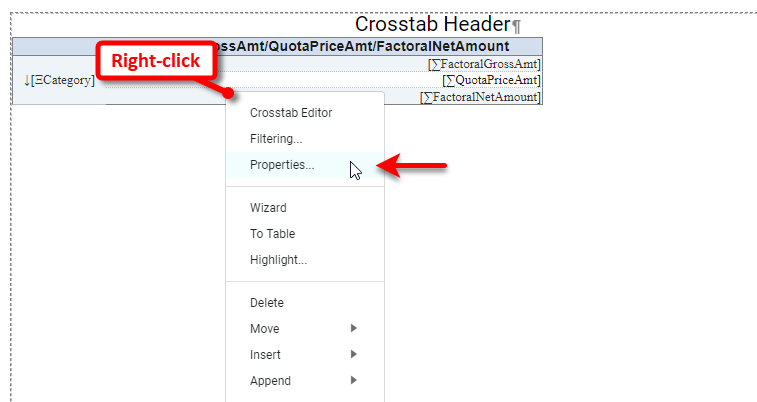
Right-click on the Crosstab, and select 'Properties'.
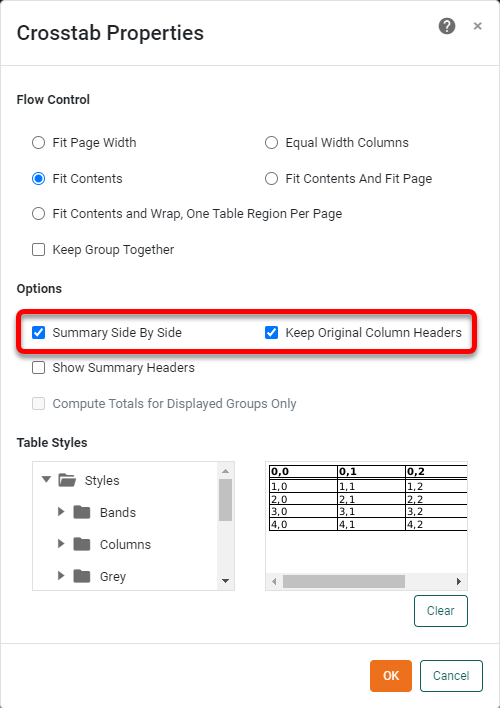
In the Crosstab Properties dialog box, select Summary Side by Side and Keep Original Column Headers.
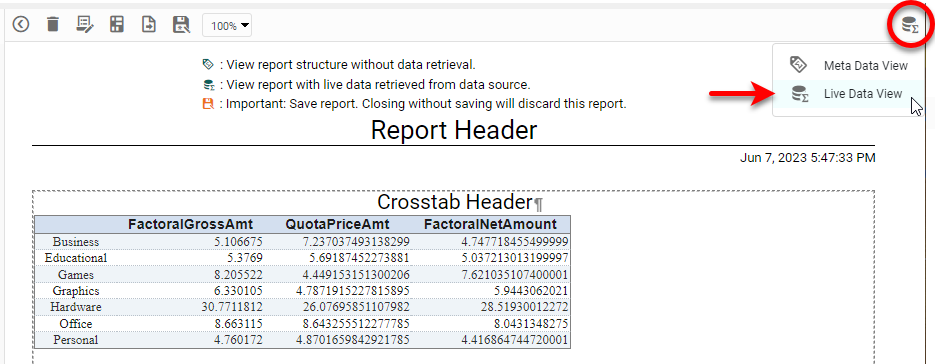
Press the Change View button, and select Live Data View.
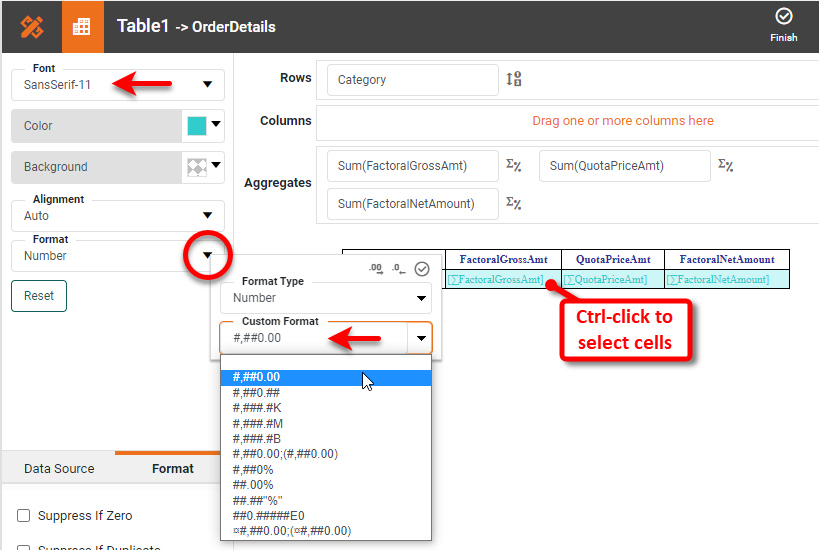
To apply formatting to the Crosstab, right-click on the Crosstab and select 'Crosstab Editor'. Select the cells that you wish to format, and use the setting in the left Format panel to make the changes. In this case, set a sans-serif font and apply a Number format with two decimal places. Change the color and alignment as desired.
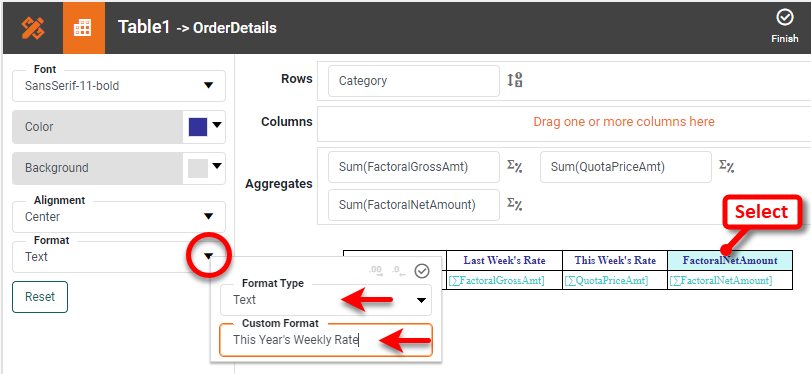
Change the column headers by assigning a Text format using the labels "Last Week's Rate," "This Week's Rate," and "This Year's Weekly Rate". This completes the Crosstab.
Add a Chart
To insert a Chart before the Crosstab, right-click on the Crosstab and select Insert > Chart.
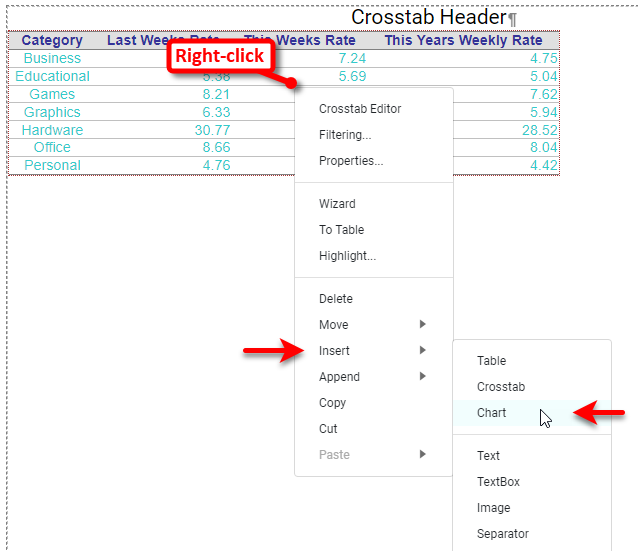
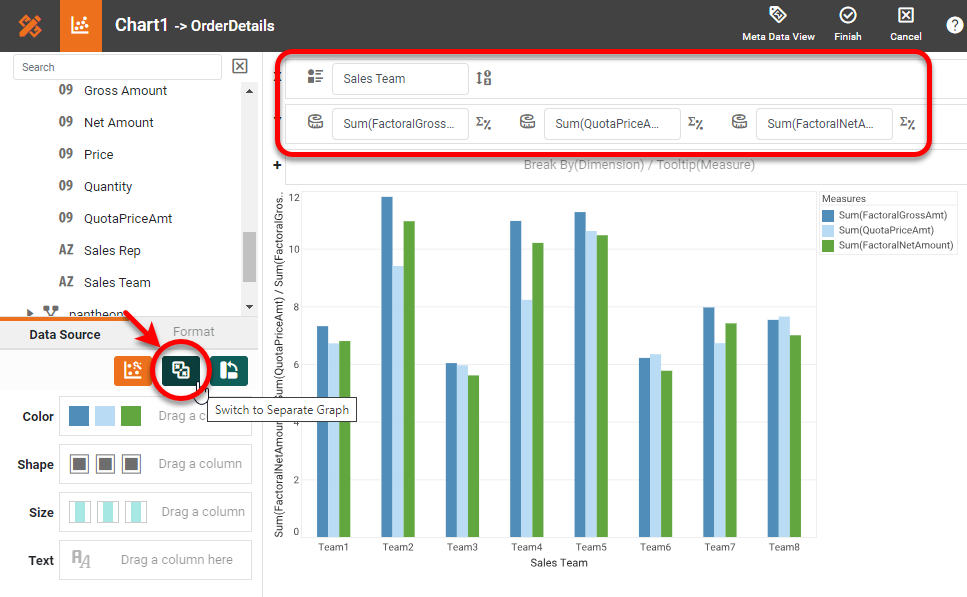
(If you do not see the Insert option, first press the Ad Hoc button in the toolbar.) Right-click on the Chart and select 'Chart Editor'. Drag the fields shown below to the X and Y regions, and press the Switch to Single Graph button.
Right-click the Y-axis and X-axis titles and select 'Hide Title'. Drag the legend below the Chart, right-click the legend and select 'Legend Properties'. Under the Alias tab, assign the alias labels shown below:
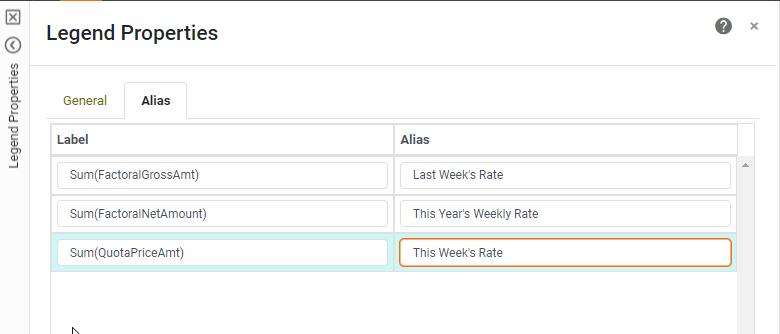
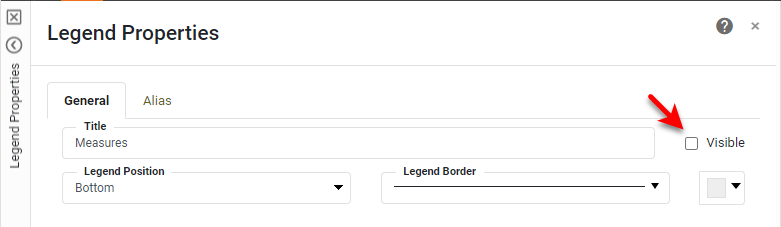
Under the General tab, set the legend title to be invisible.
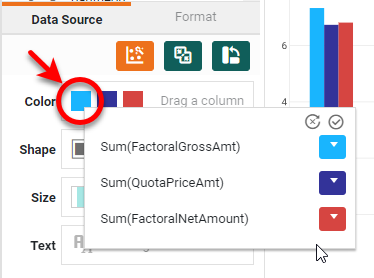
If desired, change the colors assigned to the different measures by pressing the Edit Color button.The Chart is now complete.
Add Text
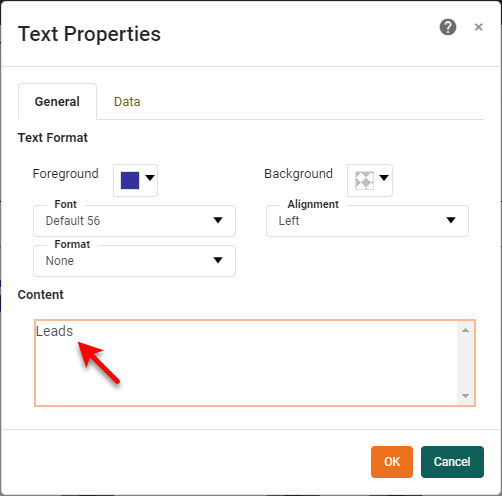
The remainder of the report is almost all text. Our design will be slightly different than the example found on the InetSoft Gallery because the Ad Hoc Report tool does not support all the page layout features of Style Studio. Begin by adding text to the title page. Right-click the text that says "Crosstab Header" and select 'Properties'. In the Text Properties dialog box, change the text to "Leads", make the text large and dark blue, and press OK.
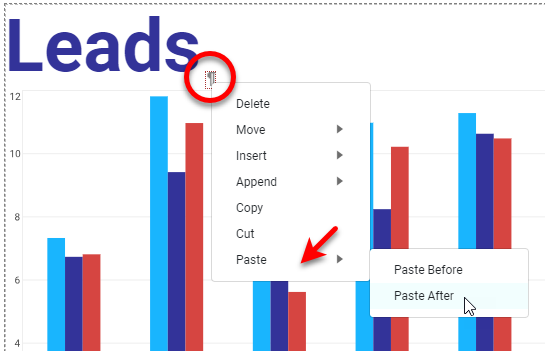
Right-click on the "Leads" text and select Append > Newline from the context menu. Then right-click the "Leads" text and select 'Copy'. Right-click the Newline element, and select Paste > Paste After.
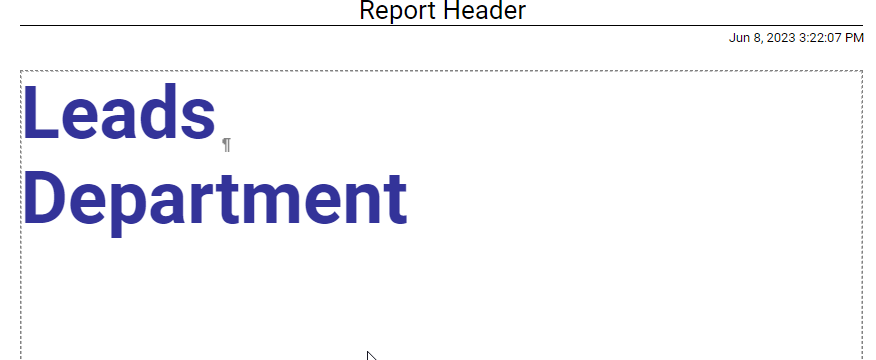
Edit the new text to say "Department"
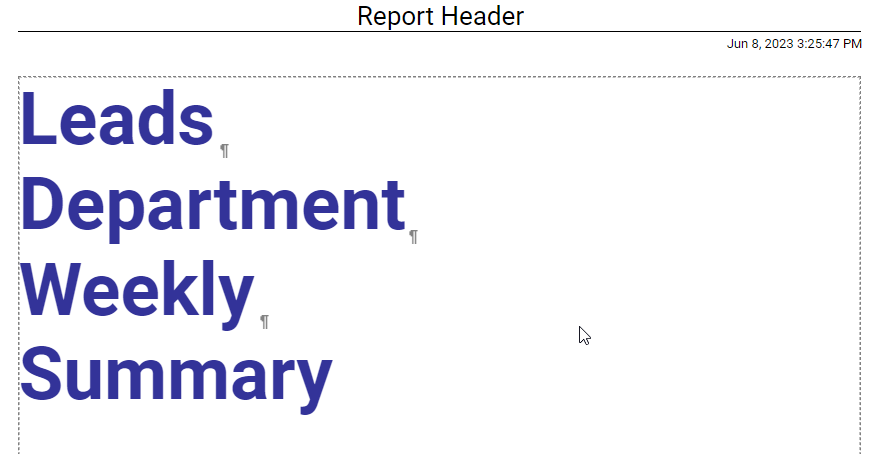
Repeat this procedure until the first page looks like this:
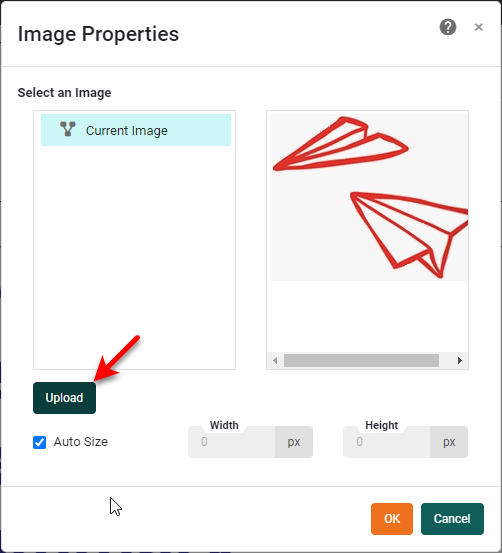
Append an Image component following the word "Summary". Right-click the Image and select 'Properties'. In the Image Properties dialog box, press the Upload button, select the desired image, and press OK.
Append a Newline following the Image and then add four Text elements separated by Newlines and a Separator. Enter the text below for the first two Text elements, and apply a background color to the second Text element. (Use the Text Properties dialog box to make these settings.)
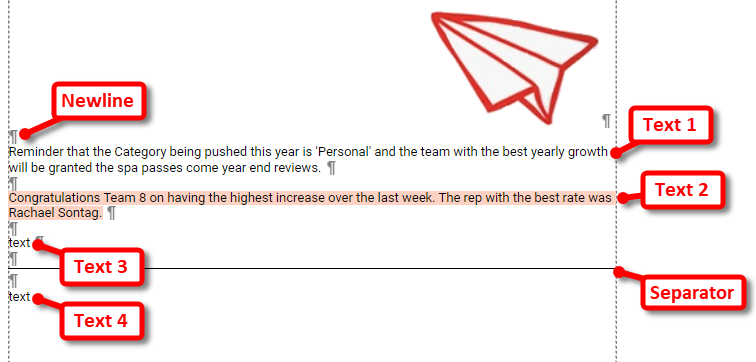
The bottom two text elements will have their contents set by script, as described below.
Add Scripted Content to Text
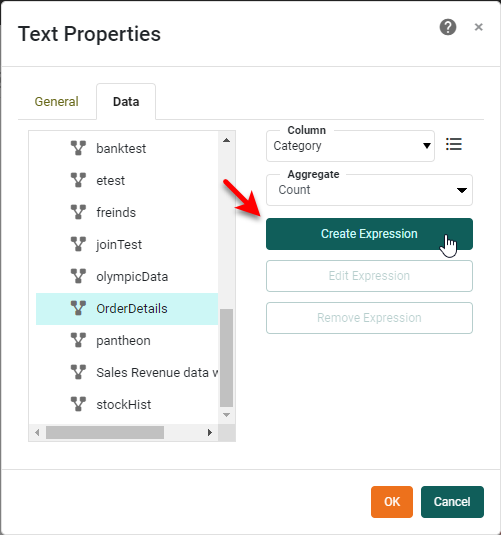
Right-click the third Text element, and select 'Properties'. In the Text Properties dialog box, select the Data tab. Select a data source (it doesn't matter which one, because we don't need the actual data), and press Create Expression.
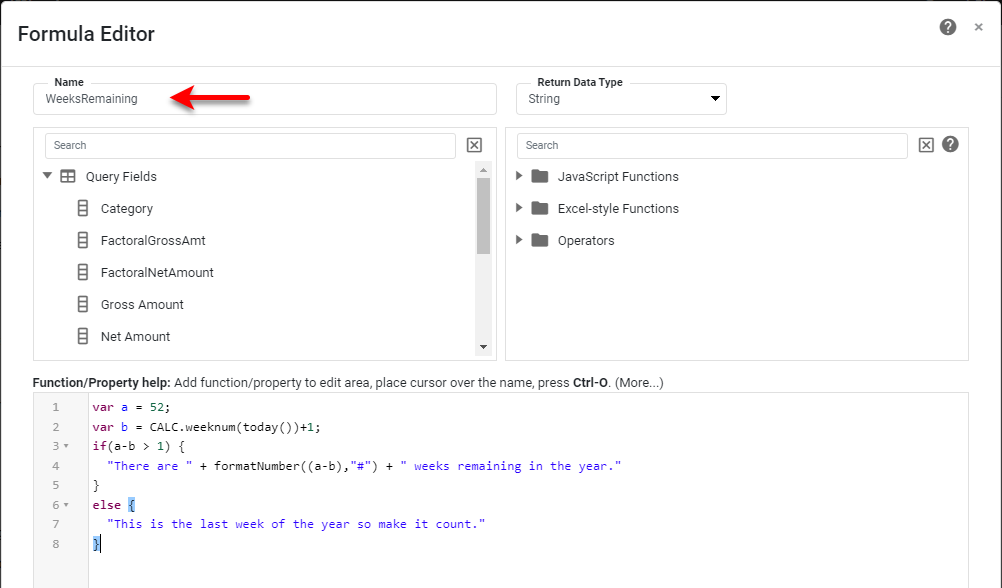
In the Formula Editor, enter the expression below, and give it the name 'WeeksRemaining':
var a = 52;
var b = CALC.weeknum(today())+1;
if(a-b > 1) {
  "There are " + formatNumber((a-b),"#") + " weeks remaining in the year."
}
else {
  "This is the last week of the year so make it count."
}
Press OK in the Formula Editor, and then select the new 'WeeksRemaining' field in the 'Column' menu and set 'Aggregate' to 'None'. Press OK.
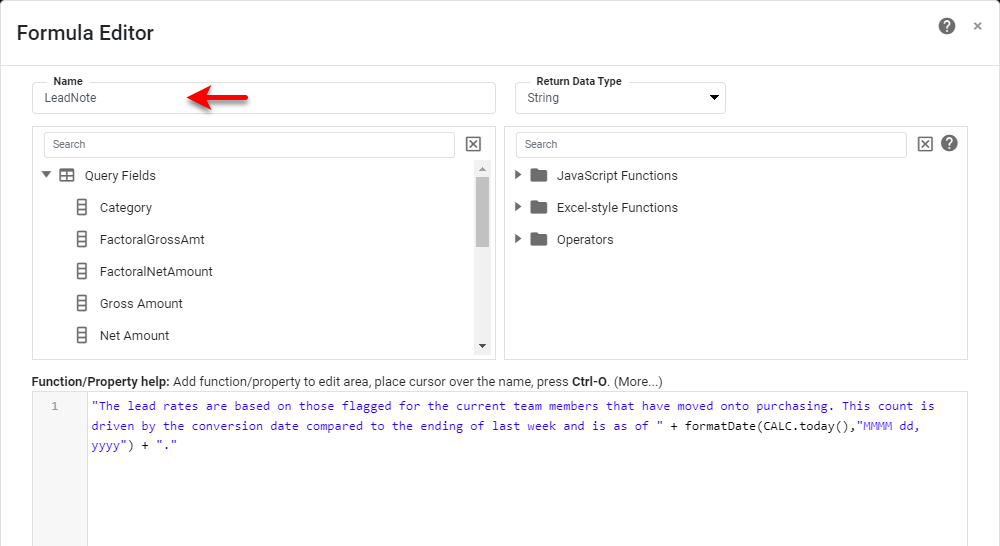
For the Text element below the Separator, repeat the same procedure, but use the following script to create an Expression named "LeadNote":
The lead rates are based on those flagged for the current team members that have
moved onto purchasing. This count is driven by the conversion date compared to the ending
of last week and is as of " + formatDate(CALC.today(),"MMMM dd, yyyy") + "."
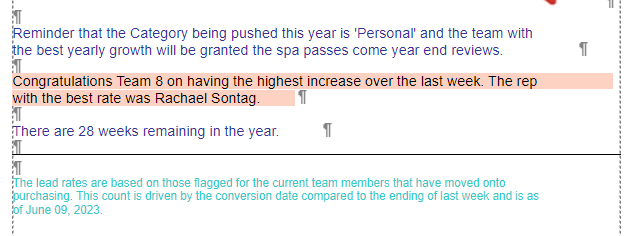
Adjust the font, size, and color of these text elements as desired:
Right-click the "Report Footer" text and select 'Properties'. Enter the following text: "Notice: This publication for internal use only. Distribution to customers or outside bodies is prohibited. ©2023". Edit the "Report Header" text to say "Team Summary". Format the header as desired.
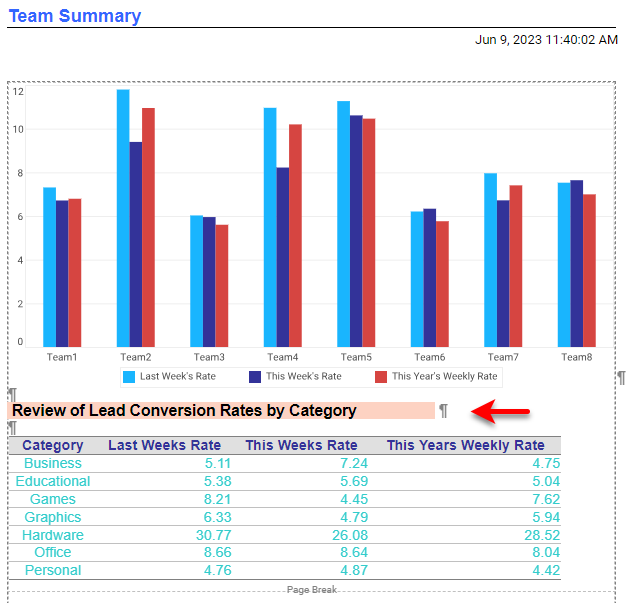
Add one final Text element above the Crosstab as shown below. Use Newline elements as needed to create spacing.
Adjust Page Setup
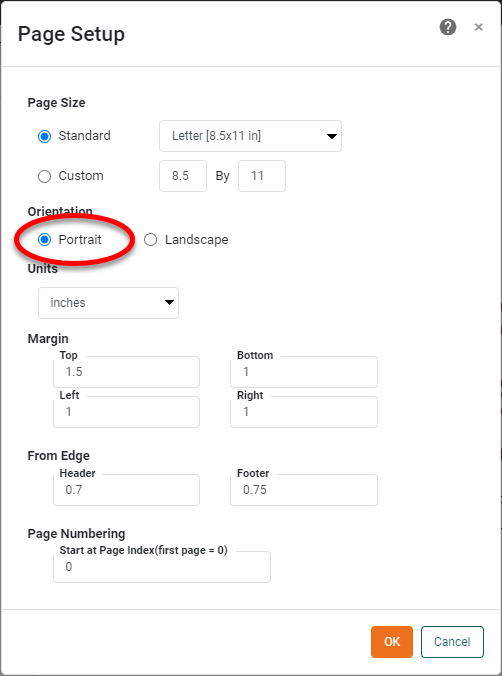
Change the page orientation from Landscape to Portrait. To do this, press the Page Setup button, select 'Portrait' option, and press OK.
The report is now complete. Press the Save button in the toolbar to save the report to the Repository.
Summary
This document has illustrated a few of the techniques for creating a paginated report using the Ad Hoc Reporting tool. You saw how to create a Chart and a Crosstab displaying multiple measures, as well as how to add both static and dynamic text. The desktop Style Studio app provides many more features for creating production reports, but the Ad Hoc Reporting described here places tremendous reporting power in the hands of business users with a simple interface that can be used on any computing platform.