Maps with Paths - Definition, Example, and How to Make Them
This page will discuss the uses of maps with paths, show you how to create them in InetSoft, and provide access to a free online tool for creating maps with paths as well as complete functioning business intelligence dashboards.
Contents
Definition of Map With Path
An Example of a Map With Path
How to Make a Map With Path
Tool to Make Maps With Paths Online for Free

A map with a path is a type of map that includes information about a specific path or route. This type of map can be used to provide directions or to show the location of a particular point of interest along a route.
A map with a path typically includes a line or series of lines that represent the path or route, along with various symbols or labels that indicate landmarks, intersections, or other points of interest along the way. The path may also be accompanied by written instructions or directions to help the user navigate the route.
Maps with paths are commonly used in a variety of contexts, including road maps, hiking maps, and bike trail maps. They can be useful for both planning and navigation, as they allow users to visualize the route and anticipate any potential obstacles or challenges that they may encounter along the way.
An Example of a Map with Path
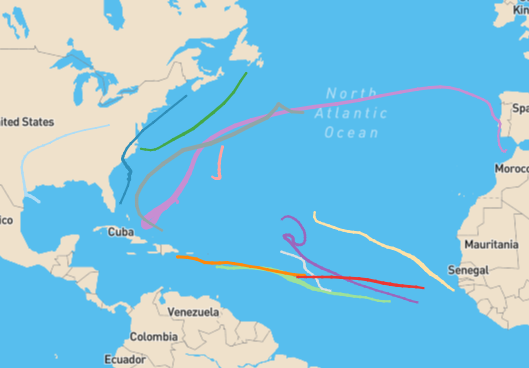
This map from the InetSoft Hurricane Tracker Dashboard show how the map with path format can display a large amount of coordinate data without being overwhelming. In the current view, this map image displays the paths of various hurricanes in the year 2015, with each hurricane labelled a specific cover.
Whereas viewing this hurricane path data in raw form would be overwhelming, viewing it in map paths gives a clear overall picture of each hurricane's trajectory. And with Inetsoft's tooltip feature, the user can hover over different paths to see the hurricane visualized and the specific coordinates.
How to Make a Map With Path in InetSoft
To display data on a map by latitude and longitude, follow the steps in the walk-through below:
Walkthrough: The 'Map Points' Data Worksheet can be found in the 'Examples' folder.
In this example, you will label a map with a list of landmarks along Historic Route 66. The locations of the landmarks are provided by the 'Map Points' Data Worksheet data block, which contains raw latitude and longitude data. The 'Map Points' Data Worksheet can be found in the 'Examples' folder. Follow the steps below:
Prepare Your Data
The data source for the chart (data block, query, or data model) should represent dimensions and measures as independent columns or fields, including a date column, as shown below. See Prepare Your Data for information on how to manipulate your data, if it is not currently in this form. (Note: A properly designed data model will already have the correct structure.)
Open a Chart for Editing
If necessary, create a new Dashboard. For information on how to create a new Dashboard, see Create a New Dashboard.
From the Toolbox panel, drag a Chart component into the Dashboard.

Resize the Chart as desired by dragging the handles.
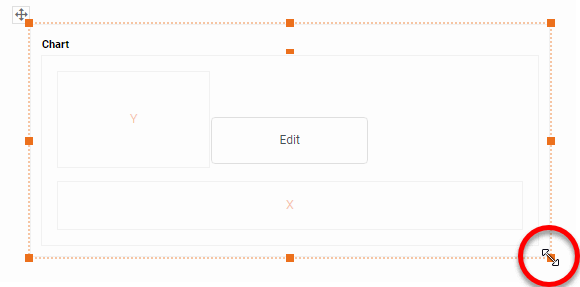
Press the 'Edit button in the center of the Chart or press the Edit' button in the top-right corner.

This opens the Visualization Recommender. Bypass the Recommender by pressing the 'Full Editor' button at the top right to open the Chart Editor.

Then follow the steps below to add data to the chart:
Press the 'Select Chart Style' button . Select the 'Map' type, and press the 'Apply' button.

Optional: If you want to use a web map background (Mapbox map or Google Map, depending on what your administrator has configured), follow the steps below:
Right-click the Chart and select 'Properties'. This opens the 'Chart Properties' dialog box.

Under the Advanced tab, enable 'Use Web Map as Background' and press 'OK'. (If this option is not available, ask your administrator to enable the Web Map feature.)

Optional: If your geographical field represents areas on the Chart (e.g., states) rather than points (e.g., cities), adjust the 'Alpha' setting to less than 100% so that the filled regions do not obscure the underlying map background.
Press 'OK' to exit the 'Chart Properties' dialog box.
Note: The Mapbox and Google Map APIs impose restrictions on the size of a map. If you see an error when you attempt to display the map background, resize the Chart to a smaller width.
In the Data Source panel, right-click the 'Lat' measure or press the 'Actions' button , and select 'Set Geographic' from the context menu. This opens the 'Edit Geographic' dialog box. The 'Lat' field contains latitude values.

From the 'Map' menu, select 'U.S.', and press 'OK'. NOTE: If you are using a Web Map background with latitude and longitude data, select the 'World' map option.

NOTE: To open the 'Edit Geographic' dialog box at a later time, right-click the 'Lat' measure or press the 'Actions' button again, and select 'Edit Geographic' from the context menu.
Repeat the above steps to set the 'Long' measure as a geographic field.
Drag the 'Long' field to the 'X' region.(The 'Long' field contains longitude values.)
Drag the 'Lat' field to the 'Y' region.

Data points now appear on the map to mark the locations specified by the latitude and longitude data, outlining Historic Route 66.
To add the landmark labels to the points on the map, drag the 'Name' field from the Data Source panel to the 'Text' field.

The labels appear fairly crowded because of the long landmark names. You can zoom the chart to see the labels more clearly.
Note: By default, the landmark names are displayed as tooltips.
Optional: Set the initial map view by selecting a region, and pressing the 'Zoom Chart' button.

You can also reposition the map as desired by pressing the 'Pan' button and dragging on the map, and by pressing the 'Zoom In' button or 'Zoom Out' button to zoom. Press the Clear' button to reset the view.

Tool to Make Map With Path Online for Free
To easily and quickly create maps with paths online for free, create a Free Individual Account on the InetSoft website. You will then be able to upload a spreadsheet data set.

Once you have done that, you will be able to proceed past the Visualization Recommender, which can usually get you started creating a dashboard. Since the Recommender does not allow you to create a map chart, press the Full Editor button.
Then proceed to build the map as described in the previous section.