Regional Maps - Definition, Example, and How to Make Them
This page will discuss the uses of regional maps, show you how to create them in InetSoft, and provide access to a free online tool for creating regional maps as well as complete functioning business intelligence dashboards.
Contents
Definition of Regional Map
An Example of a Regional Map
How to Make a Regional Map
Tool to Make Regional Maps Online for Free

A regional map is a type of map that shows the political or administrative boundaries of a particular land mass,. such as states, provinces, or counties. Regional maps can also show important cultural or economic features of an area, such as cities, roads, and landmarks.A regional map is a type of map that shows the political or administrative boundaries of a particular land mass,. such as states, provinces, or counties. Regional maps can also show important cultural or economic features of an area, such as cities, roads, and landmarks.
Regional maps can be created using various techniques, including hand-drawn or computer-generated maps. They can also be customized to show different levels of detail, such as topographical information or population density. Regional maps are used in a variety of contexts, including education, tourism, urban planning, and environmental research.
By providing a visual representation of a particular region or area, regional maps make it easier to understand the location, size, and shape of different features. They help viewers understand how different features relate to each other, and how they impact the region as a whole.
Regional maps can be used for planning and decision-making purposes, such as identifying areas for development or preservation, assessing environmental impact, or identifying potential hazards. Regional maps can be used as historical references, allowing viewers to see how the region has changed over time, and providing insights into the area's cultural and political evolution.
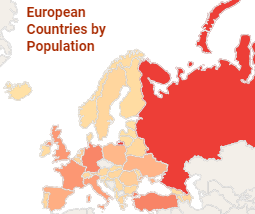
An Example of a Regional Map
This map of European countries colored by population can provide valuable insights into the distribution and density of population across the continent. By using different colors or shades to represent different levels of population, this map quickly highlights areas of high and low population density, and can aid in the identifying of patterns and trends in population distribution.
How to Make a Regional Map in InetSoft
To display data on a map by region (state, city, zip code, etc.), follow the steps below::
Prepare Your Data
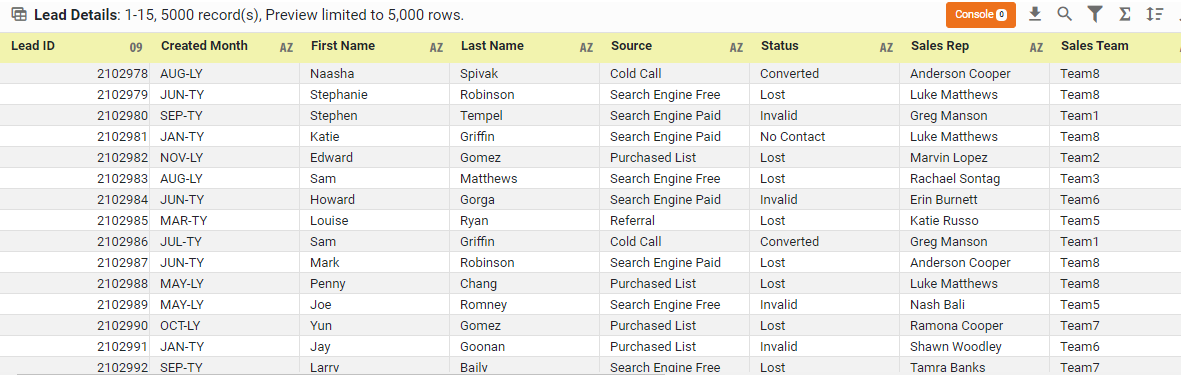
The data source for the chart (data block, query, or data model) should represent dimensions and measures as independent columns or fields, including a date column, as shown below. See Prepare Your Data for information on how to manipulate your data, if it is not currently in this form. (Note: A properly designed data model will already have the correct structure.)
Open a Chart for Editing
If necessary, create a new Dashboard. For information on how to create a new Dashboard, see Create a New Dashboard.
From the Toolbox panel, drag a Chart component into the Dashboard.

Resize the Chart as desired by dragging the handles.
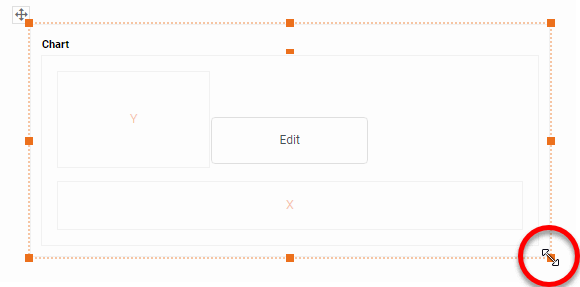
Press the 'Edit button in the center of the Chart or press the Edit' button in the top-right corner.

This opens the Visualization Recommender. Bypass the Recommender by pressing the 'Full Editor' button at the top right to open the Chart Editor.

Then follow the steps below to add data to the chart:
Press the 'Select Chart Style' button , and choose the 'Map' chart type. Press the 'Apply' button (or double-click the 'Map' icon).

The Chart Editor now provides a 'Geographic field.
Mark the dimensions you want to use on the map as geographical fields using the steps below.
Right-click the field in the tree or press the 'Actions' button , and select 'Set Geographic' from the context menu. This places a location icon next to the field name.

If the field is shown with a mapped location icon , this means the field has been already been mapped to a geographical level. If the field is shown with an unmapped location icon , this means you may need to set the geographical level for the field or resolve location names.
To set the geographical level, right-click the field name or press the 'Actions' button , and select 'Edit Geographic' from the context menu. This opens the 'Edit Geographic' dialog box.

In the 'Edit Geographic' dialog box, select the desired region from the 'Map' menu: Asia, Canada, Europe, Mexico, U.S., or World. The map that you select for a geographic field applies to all other geographical fields.
From the 'Layer' menu, select the geographical layer that corresponds to the data in the selected field.
This specifies the layer of the geographical database against which field values should be matched (e.g., city names should be matched against the city layer, etc.). The options available in the 'Layer' menu depend on the previously selected 'Map' option.
From the 'Mapping' menu, select the desired map database.
The Chart Editor attempts to resolve values in the selected geographic field against the corresponding layer in the map database. If the field was shown with an unmapped location icon , this means you may need to resolve location names. To do this, press the 'Edit' button next to the "Mapping' menu. This opens the 'Geographic Mapping' dialog box, which allows you to manually match place names. Make any required matches and press 'OK'.

To remove the geographical status of a field, right click the field or press the 'Actions' button , and select 'Clear Geographic' from the context menu.
Tool to Make a Regional Map Online for Free
To easily and quickly create regional maps online for free, create a Free Individual Account on the InetSoft website. You will then be able to upload a spreadsheet data set.

Once you have done that, you will be able to proceed past the Visualization Recommender, which can usually get you started creating a dashboard. Since the Recommender does not allow you to create a map chart, press the Full Editor button.
Then proceed to build the map as described in the previous section.