How to Create a Human Resources Dashboard
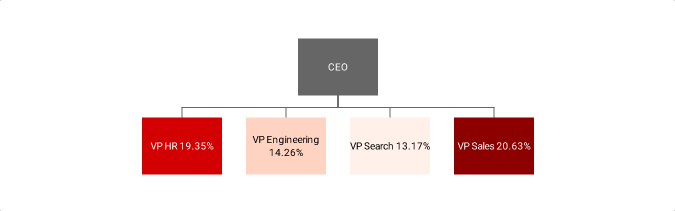
This training page will explain how to create a human resources dashboard such as the one below using dashboard creation software from InetSoft. A working version of this dashboard can be found on the InetSoft Gallery. This dashboard is primarily composed of charts. Below, we will examine some of these charts, discuss their value for Human Resourcesand see how easy they are to create with InetSoft's solution..
Contents
Using Dashboards for Human Resources
The Importance of Tracking Attrition
Tree Charts
Using a Tree Chart to Track Attrition by Senior Title
Create a Tree Chart
Step Area Charts
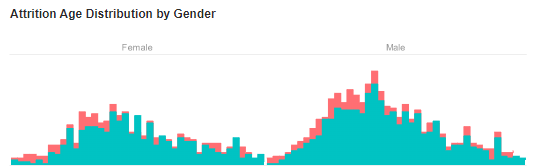
Tracking Attrition by Age and Sex
Create Step Area Charts
Summary

Using Dashboards for Human Resources
Interactive dashboards for HR provide real-time data analysis, allowing HR professionals to quickly access and analyze key metrics such as employee turnover rate, recruitment metrics, and employee engagement levels. This data can help HR professionals make informed decisions and take timely action. Interactive dashboards allow HR professionals to visualize data in the form of charts, graphs, and tables, making it easier to understand and interpret complex data. This can help HR professionals identify patterns and trends that might not be immediately apparent in raw data. Dashboards can be customized to meet the specific needs of the HR department. HR professionals can choose the metrics and KPIs that are most relevant to their organization and customize the dashboard to display this information in a clear and concise manner.
Interactive dashboards can improve communication between HR professionals and other stakeholders, such as senior management and employees. The visual nature of the dashboards makes it easier to share data and insights with others in a way that is easily understood. Dashboards can help HR professionals streamline their workflows and increase efficiency by providing a centralized location for all HR-related data. This can save time and reduce the risk of errors associated with manual data entry and analysis.
Overall, interactive dashboards can help HR professionals make better decisions, communicate more effectively, and increase efficiency, leading to improved HR management practices and better business outcomes.
The Importance of Tracking Atrition
Tracking attrition data is important for HR managers because it provides valuable insights into employee retention and turnover rates within an organization. By tracking attrition data, HR managers can identify problem areas and determine the reasons why employees are leaving the organization. This can help to address underlying issues such as low employee morale, lack of career advancement opportunities, or poor working conditions. Once problem areas have been identified, HR managers can develop strategies to improve employee retention. This may involve implementing initiatives such as employee training programs, offering competitive compensation and benefits packages, or improving the overall work environment.
High attrition rates can be costly for organizations, as they need to spend time and money on recruiting and training new employees. By tracking attrition data and improving employee retention, HR managers can reduce recruitment costs and improve the overall financial health of the organization. Enhancing employer brand: Organizations with low attrition rates tend to have a positive employer brand, which can attract top talent and improve the organization's reputation in the industry. By tracking attrition data and improving employee retention, HR managers can help to enhance the organization's employer brand.
Attrition data can help HR managers make informed decisions about organizational structure, workforce planning, and talent management. This data can help to identify areas where additional resources are needed, or where changes in the workforce may be required to improve overall business performance.
Overall, tracking attrition data is essential for HR managers to understand the dynamics of their workforce and develop effective strategies to improve employee retention and overall business performance.
Introduction of Tree Charts
A tree chart or tree diagram is a graphical representation of a hierarchical structure, commonly used to show the relationships between different levels of categories or concepts.
The tree diagram is called so because it resembles the structure of a tree with branches and sub-branches. It is composed of nodes, which represent the categories or concepts, and branches, which represent the relationships between these categories or concepts. Each node represents a specific category or concept, while each branch represents a relationship between the categories or concepts.
The diagram is read from top to bottom, with the topmost node representing the most general category or concept, and the nodes beneath it representing increasingly specific subcategories or concepts. The branches connecting the nodes represent the hierarchical relationships between the categories or concepts.
Tree diagrams are commonly used in fields such as mathematics, computer science, linguistics, and organizational management to represent complex systems, processes, and structures in a visual and easily understandable way.
Using a Tree Chart to Track Attrition by Senior Title
A tree diagram can provide a clear and concise representation of the organizational hierarchy, showing the relationships between different levels of management and employees in a simple and easy-to-understand way. It provides a structured representation of the organizational hierarchy, making it easy to identify the different levels of management and employees and their respective roles and responsibilities.
Tracking attrition among top management positions is particularly important for organizations as it can have a significant impact on the overall success of the business. Here are some benefits of tracking attrition among top management positions. Top management positions play a critical role in shaping an organization's strategy and direction. By tracking attrition among these positions, HR managers can identify potential leadership gaps and take steps to fill them before they become a problem.
High turnover rates among top management positions can create instability within an organization, which can negatively impact employee morale and overall business performance. By tracking attrition among top management positions, HR managers can take steps to maintain organizational stability and ensure business continuity. Top managers often have a wealth of institutional knowledge and experience that is critical to the success of an organization. By tracking attrition among top management positions, HR managers can take steps to preserve this knowledge and ensure that it is passed on to new leadership.
Tracking attrition among top management positions can also help with succession planning. By identifying potential leadership gaps early, HR managers can develop a pipeline of potential candidates for these positions and ensure a smooth transition when a top manager leaves the organization. High turnover rates among top management positions can damage an organization's employer brand and reputation in the industry. By tracking attrition among top management positions and taking steps to maintain organizational stability and continuity, HR managers can help to enhance the organization's reputation and attract top talent.
Overall, tracking attrition among top management positions is essential for organizations to maintain stability, preserve institutional knowledge, and ensure business continuity. It also supports succession planning and helps to enhance the organization's reputation in the industry.
Creating the Tree Chart
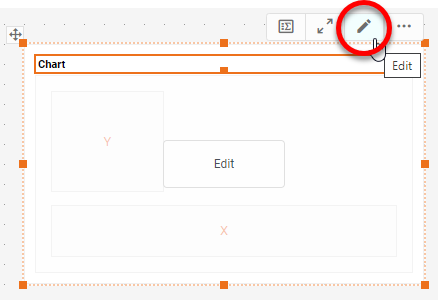
This is a very simple chart to create with InetSoft. To do this, first add a new Chart component into the dashboard using Visual Composer.

Press the Edit button on the Chart to open the Chart Editor.
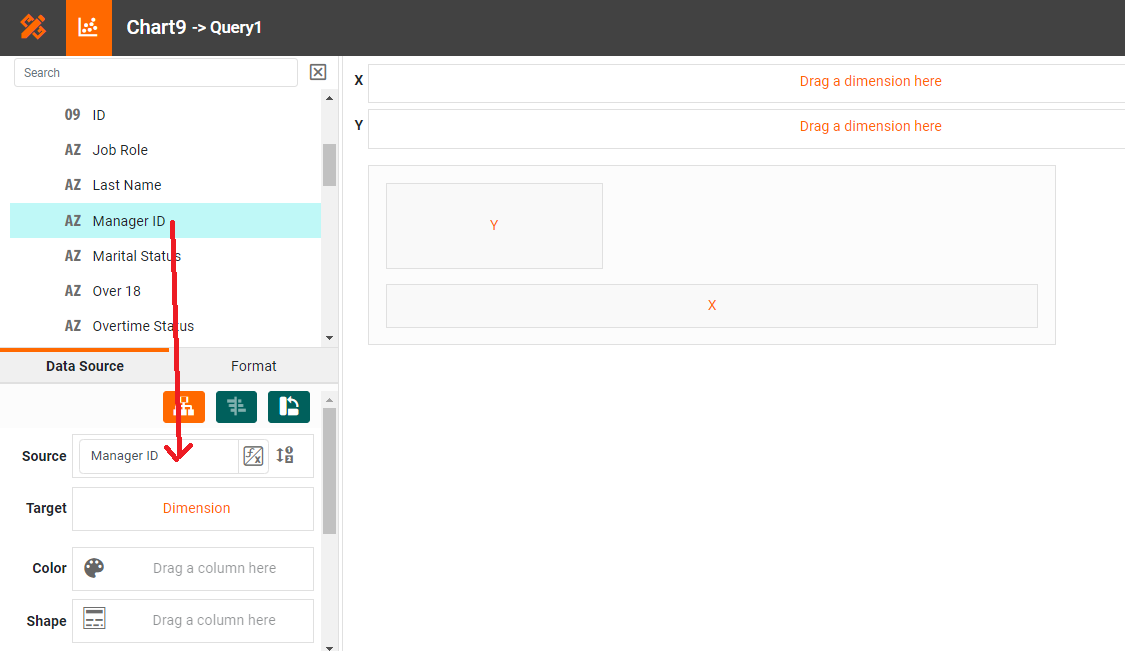
Press the 'Select Chart Style' button . Choose the 'Tree Chart' style. Press the 'Apply' button.

From the 'Dimensions' folder of the Data Source panel, drag the 'Manager ID' dimension to the 'Source' region.
From the 'Dimensions' folder of the Data Source panel, drag the desired child dimension 'ID' to the 'Target' region.
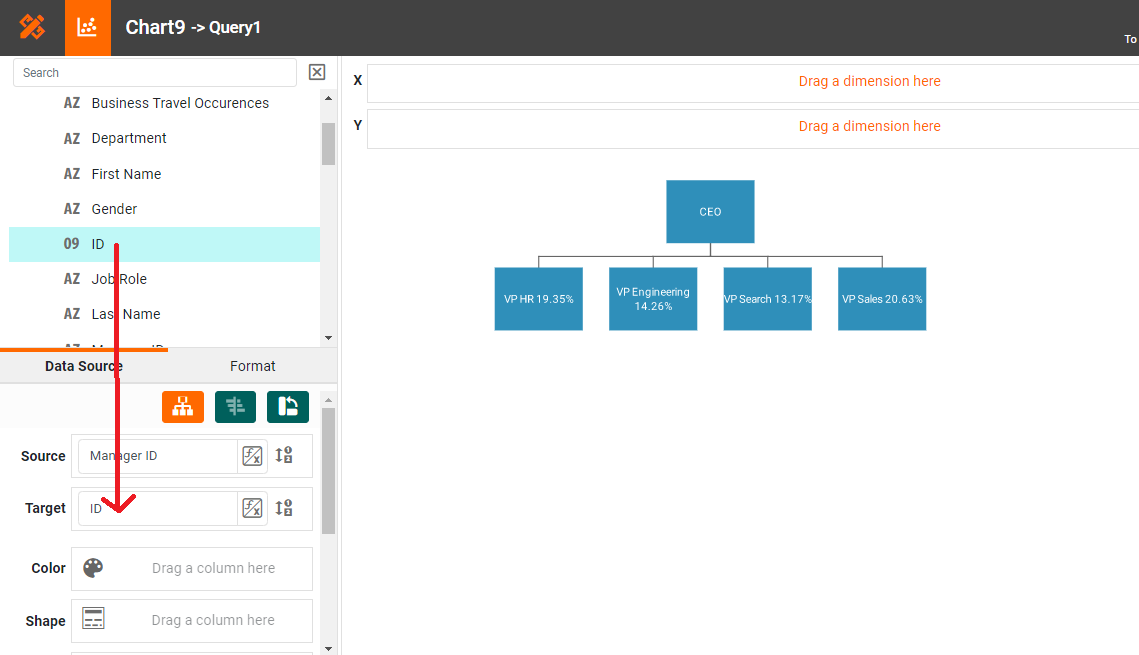
To represent an aggregate on the chart, from the 'Measures' folder of the Data Source panel, drag the measure 'VIP Attrition Rate' to the 'Color' region. Press the 'Edit' button next to 'Color' to adjust the settings. NOTE: The applied node style is based on the values in the 'Target' field. If some nodes are only 'Source' nodes and not also 'Target' nodes, these nodes will inherit the edge color. To force such source nodes to adopt the color of their first target in the data set instead, enable 'Apply Aesthetics to Source Nodes' in the 'Chart Properties' dialog box.
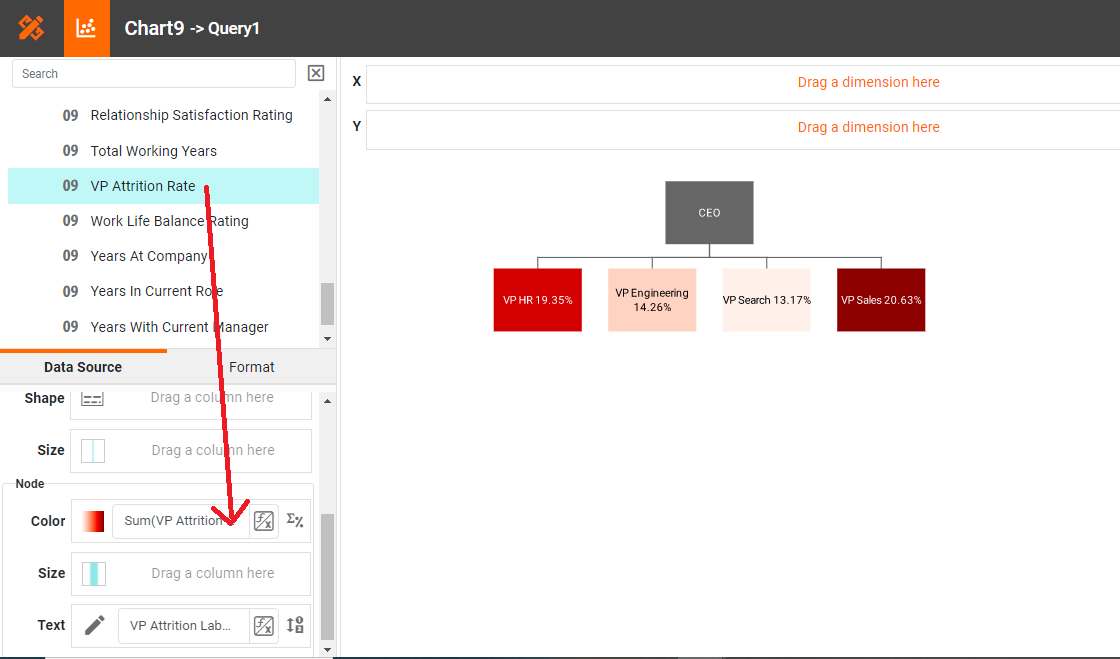
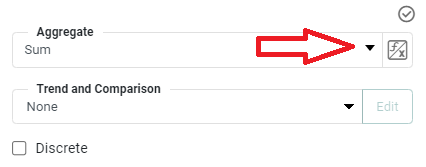
Press the 'Edit Measure' button next to the measure, and select the desired aggregation method 'sum' for the measure.
Step Area Charts
A step area chart is a type of data visualization that is used to display data over time. It is similar to a regular area chart, but the lines connecting the data points are drawn in a stepped fashion, creating a stair-step effect. This type of chart is particularly useful for showing changes in data over time, as it emphasizes the change in values from one data point to the next.
The step area chart consists of two axes: the horizontal axis shows the time period being analyzed, while the vertical axis shows the value of the data being tracked. The area under the line is typically filled with a color, allowing the viewer to easily see the overall trend of the data.
The stepped lines in the chart provide a clear indication of the changes in the data from one period to the next, making it easy to see the direction of the trend. This can be particularly useful when analyzing data with multiple data points, as it allows the viewer to easily identify the points where significant changes occurred.
Overall, the step area chart is a useful tool for visualizing data over time, as it provides a clear and concise way of showing changes in data values. It can be used in a variety of contexts, including finance, sales, and marketing, to track trends and identify areas for improvement.
Tracking Attrition by Age and Sex
Tracking attrition by sex and age is important for organizations because it can provide valuable insights into potential patterns and trends that may be occurring within the workforce. By tracking attrition by sex and age, HR managers can identify potential issues related to gender, age, and length of service. For example, if there is a higher attrition rate among older female employees, it may indicate underlying issues related to age discrimination, career advancement opportunities, or organizational culture.
Tracking attrition by sex and age can help organizations to identify any potential disparities and take action to promote diversity and inclusion within the workplace. By identifying patterns in attrition rates, HR managers can take targeted steps to address any disparities that may exist and ensure that all employees feel valued and supported. High attrition rates can be a sign of low employee engagement. By tracking attrition by sex and age, HR managers can identify potential areas for improvement in employee engagement and take steps to address them. This may involve providing additional training and development opportunities, improving communication channels, or offering more flexibility in work arrangements.
High attrition rates can be costly for organizations, as they need to spend time and money on recruiting and training new employees. By tracking attrition by sex and age, HR managers can identify potential areas where retention efforts may be required, thereby reducing recruitment costs and improving the overall financial health of the organization. Attrition data can help HR managers make informed decisions about organizational structure, workforce planning, and talent management. By tracking attrition by sex and age, HR managers can identify potential areas where additional resources may be required or where changes in the workforce may be required to improve overall business performance.
Tracking attrition by sex and age is essential for HR managers to understand the dynamics of their workforce and develop effective strategies to improve employee retention, promote diversity and inclusion, and improve overall business performance.
Create Step Area Chart
From the Toolbox panel, drag a Chart component into the Dashboard.

Press the 'Select Chart Style' button . Choose the 'Step Area' style. Press the 'Apply' button.
From the 'Dimensions' folder of the Data Source panel, drag the gender and age dimensions to the 'X' region.
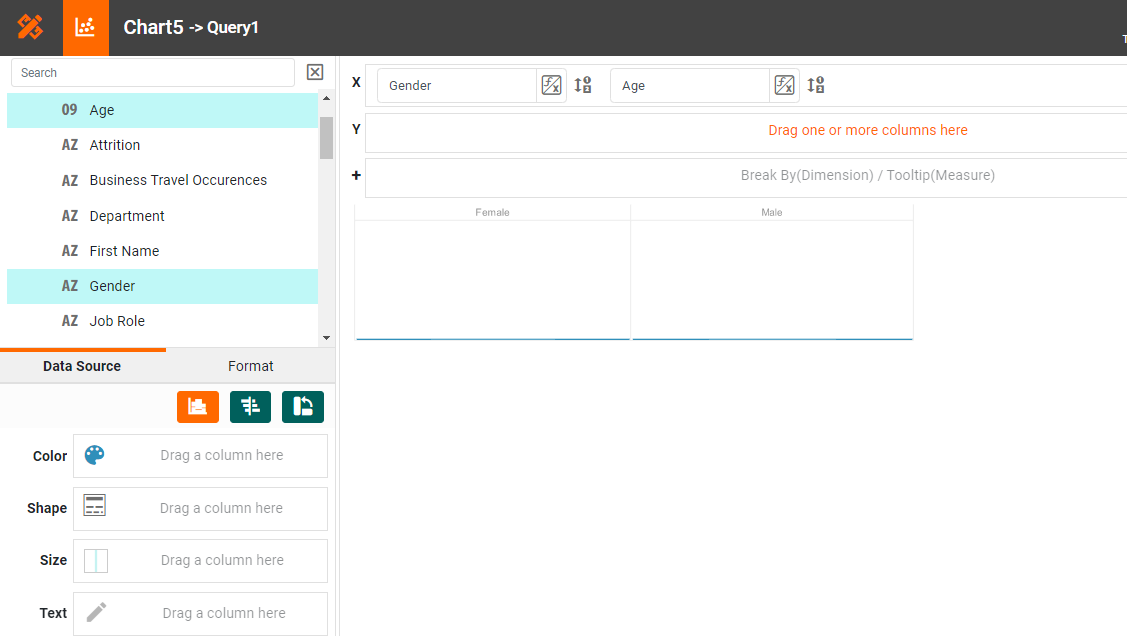
To break-out the data set into groups using color labeling, drag the 'Attrition' dimension from the Data Source panel to the 'Color' region.
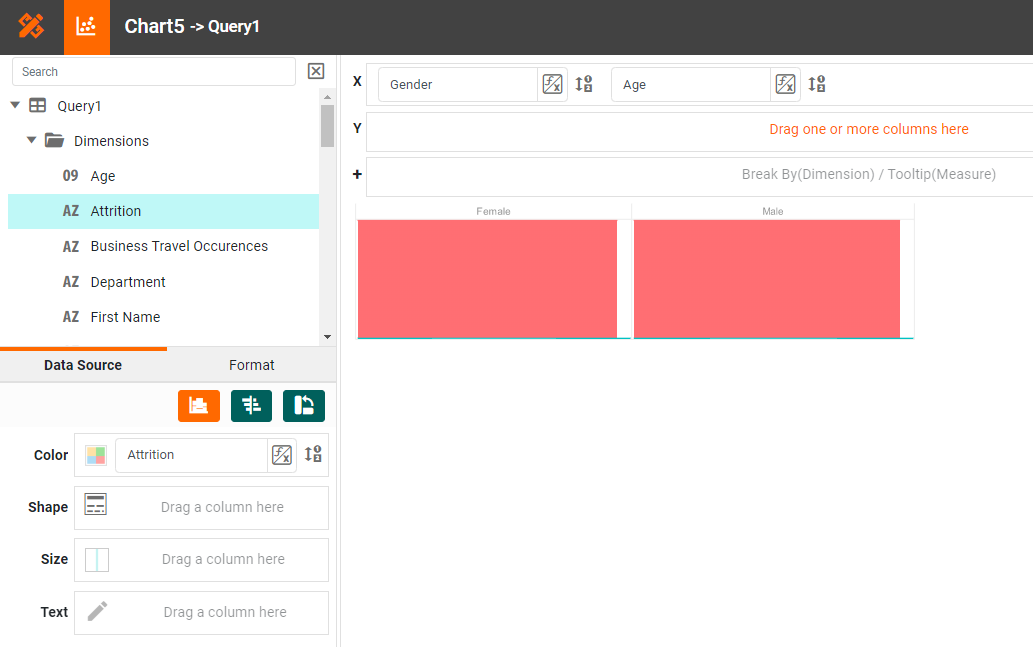
To break-out the data into groups without applying any visual formatting, drag a dimension to the 'Break By/Tooltip' region.
From the 'Measures' folder of the Data Source panel, drag the 'Employee ID Number' measure to the 'Y' region. This places the selected field onto the chart as a measure.
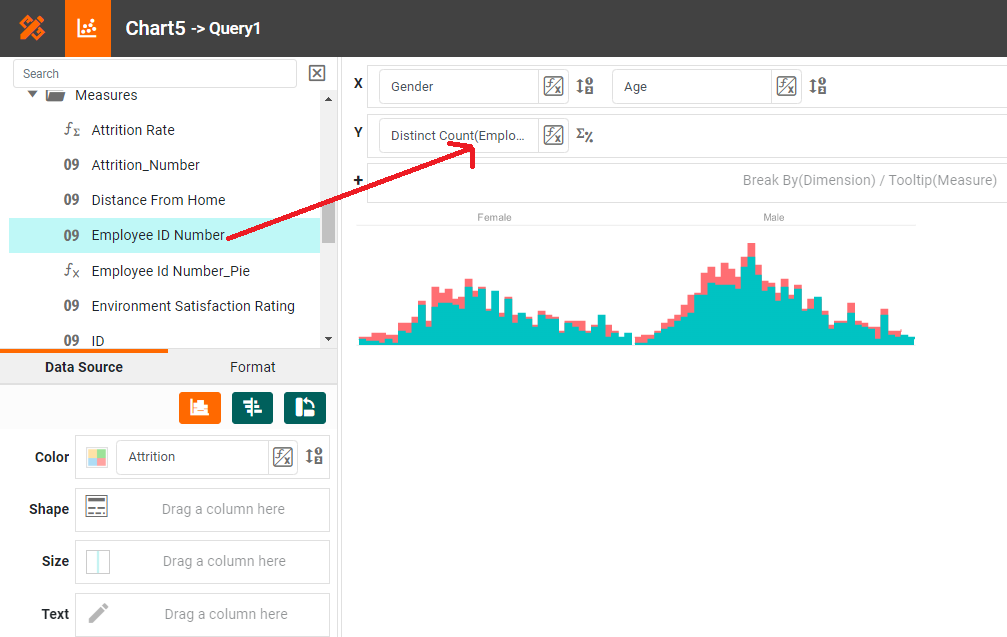
NOTE: To convert a measure to a dimension, right-click the measure in the Data Source panel and select 'Convert to Dimension'.
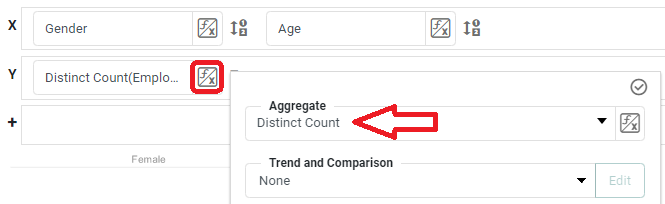
Press the 'Edit Measure' button next to the measure, and select the desired 'Distinct Count' aggregation method for the measure.
To represent a measure by using tooltip information, drag the measure to the 'Break By/Tooltip' region.
Summary
This page has gone over a few of the techniques used to create a dynamic and powerful Human Resources Dashboard. You saw how to create step area and tree charts, and how to use them to analyze the most important aspects of employee attrition. InetSoft makes it quick and easy to display data in a wide variety of different styles for exploration and interaction. InetSoft additionally provides many other features to facilitate the creation of professional dashboards, such as embedding, hyperlinks, drill-downs, positioning and sizing aids, device-adaptive layout, advanced scripting, and much more. InetSoft is a complete solution for modern, powerful, and effective dashboards.