Option for Hyperion Dashboard Reporting
Since 1996, InetSoft has offered its dashboard software to financial institutions and enterprises alike. InetSoft's StyleBI is a comprehensive platform that will redefine your consolidation, reporting, and performance management functions. It is easy, agile, and robust.
Whereas Hyperion is a sophisticated BI tool for business performance, InetSoft's StyleBI, provides a different level of interactivity and dashboard appeal. While other vendors offer advanced tools for operational use only, our software provides easy access and employment to any and all users with unique and intuitive data mashup capabilities. This allows users to combine disparate data from a multitude of featured databases, including our support for Hyperion Essbase.
StyleBI uses a platform with an intuitive user interface that accelerates the usage of BI. Requirements that include reporting, OLAP, scorecards, dashboards, visualization, and ad hoc analysis are all met in one unified application.

Upgrade Your Hyperion Dashboard Reporting
StyleBI™ is a sophisticated platform providing dashboards that are customizable for any financial institution. Do you require the most current dashboard system to support your strategic and operational management decisions? Our software is capable of creating financial reports as well as rich, interactive dashboards.
We provide the easiest, most agile, and robust solutions to help field employees to executive management understand investments, compliance, audit trails, and more. All of this from a web based application that can be used with standard browsers.
Data Access and Mashup
- Real-time data mashup Data Block™ architecture
- Professional atomic data block modeling tool
- Web based data mashup accessible by end users
- Easy connectivity to relational databases (JDBC), multidimensional databases, XML, SOAP, Java beans (POJO), Microsoft Excel, flat files, OLAP cubes, SAP, PeopleSoft, JD Edwards, and Siebel CRM
- Security control at the data cell level for users, roles and groups
- Agile mashup across multiple domains and multiple data sources
- High performance scalability for large data sets, and large volumes of users
Data Grid Cache Technology
- Embedded dashboarding - a Java-style API and multiple integration points allow developers maximum control over programmatic use of dashboarding and reporting
Visualizations, Dashboards and Visual Analysis
- Web based mobile dashboards accessible from devices including iPhones,smartphones, Apple based & Android-based tablets
- Use standard web browsers - e.g., Chrome, Internet Explorer, Firefox, Safari
- Unlimited multi-dimensional charting
- Drill down across views and into details
- Wide range of robust chart types including custom geographic mapping
- Visualization view re-use and collaboration
- Drag & drop design, spreadsheet-like design
- Use charts, maps, gauges, thermometers, and other visual displays
- Dual purpose input/output elements
- Views assembled from sub-level views
- Monitoring and analysis oriented views
- Export to Excel, PowerPoint, PDF, RTF-Word, CSV, PostScript, Text, and SVG
- Snapshot archiving
Register for a personalized demo
Do People Still Use Hyperion Dashboards?
Yes, many large enterprises still use Hyperion dashboards, especially in finance and accounting departments for financial close, consolidation, and advanced reporting, but adoption has slowed as organizations gradually migrate to more modern, self-service BI platforms that offer faster development, interactive visualizations, and easier cloud deployment.
What Are the Drawbacks of Hyperion Dashboards?
Hyperion dashboards, part of Oracle's suite of financial and enterprise performance management tools, have been a staple in many large enterprises for financial close, planning, and reporting for decades. While these dashboards offer a strong foundation for financial and operational reporting, they also come with several drawbacks that organizations need to consider as they evaluate modernizing their analytics infrastructure.
1. Complexity in Deployment and Maintenance
Hyperion dashboards require a complex and often heavy IT footprint for deployment and maintenance. Setting up and maintaining the environment typically involves multiple components such as Hyperion Planning, Financial Management, Essbase, and the underlying Oracle databases, each with its own configuration requirements. Managing upgrades, security patches, and performance tuning in a Hyperion environment can demand significant IT resources, making the system less agile and harder to adapt to rapid business changes.
2. Limited Flexibility for Ad Hoc Analysis
Another drawback of Hyperion dashboards is their limited flexibility for business users to perform ad hoc analysis. While financial and operational dashboards can be predefined and distributed, users often struggle to adjust parameters, drill into different data dimensions, or create new visualizations on the fly without IT involvement. This limits the self-service capabilities that modern business users expect, often requiring them to wait for IT teams to build or modify reports, which slows down decision-making.
3. User Interface and Visualization Constraints
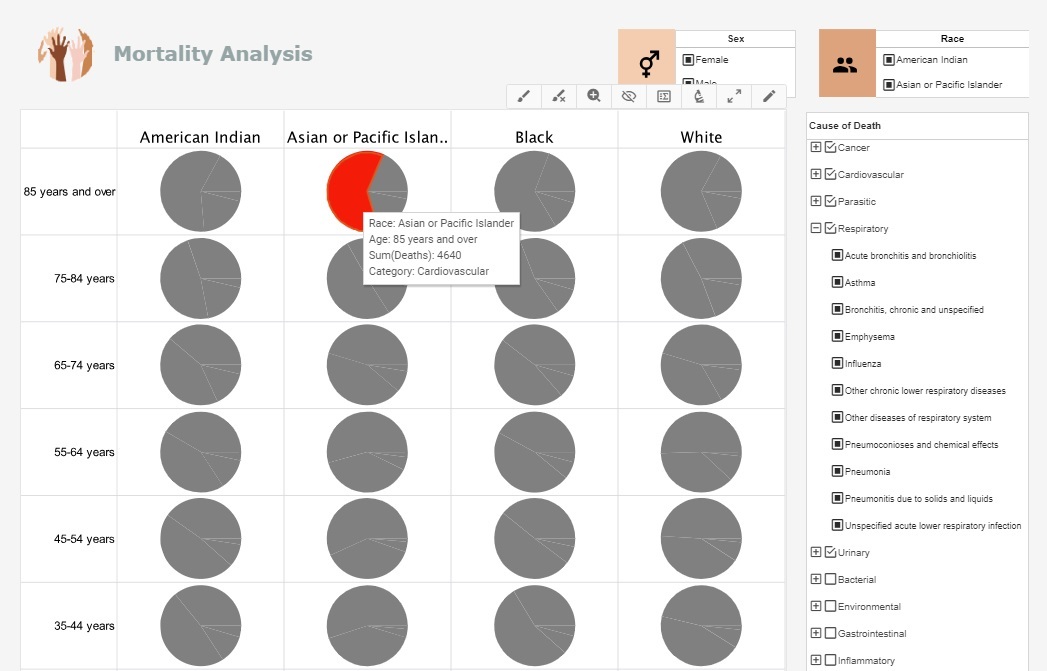
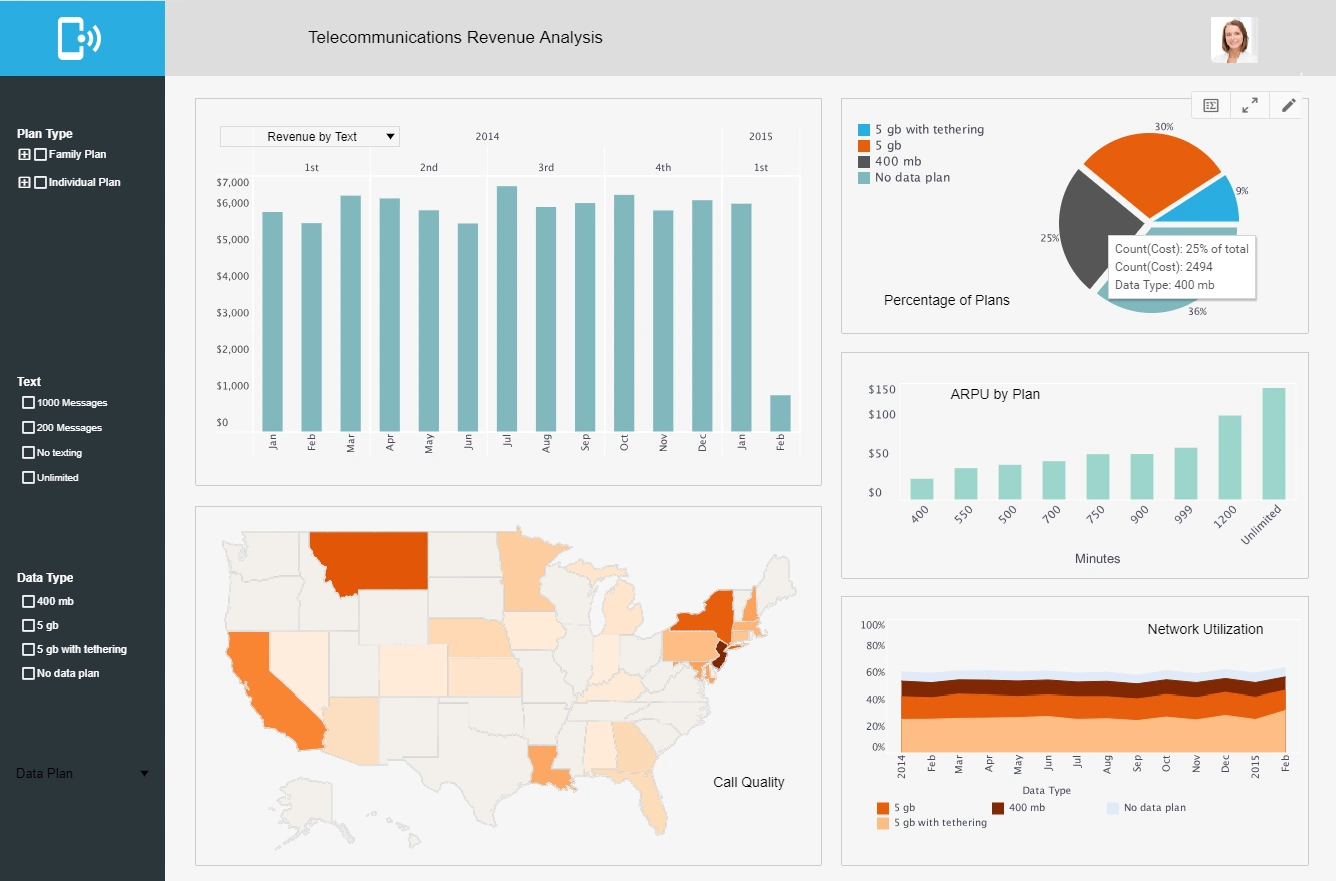
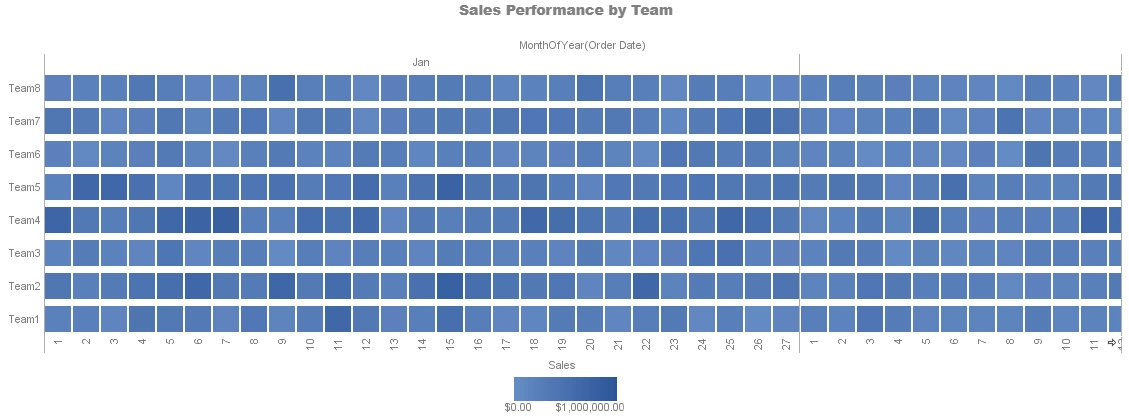
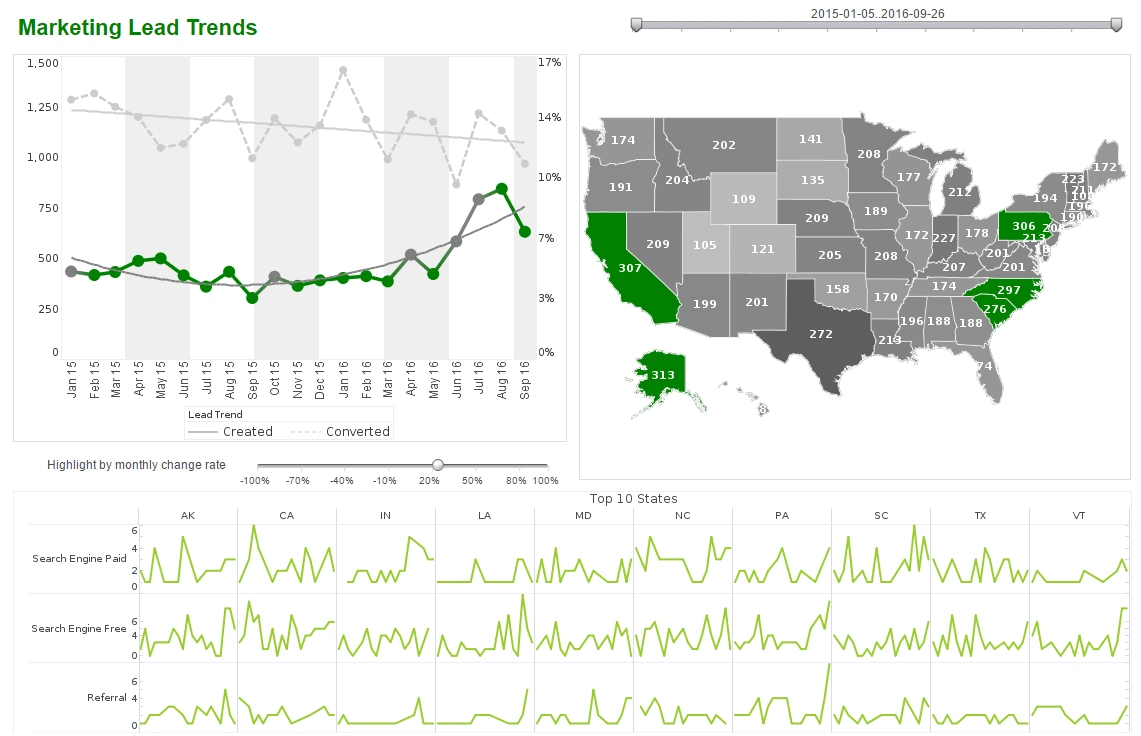
Compared to modern BI tools like InetSoft StyleBI, Power BI, or Tableau, Hyperion dashboards often lag in terms of user interface design and interactive visual capabilities. The interface can feel dated, and dashboards can lack advanced visualization types that are now standard in other BI platforms, such as heatmaps, interactive maps, and dynamic drill-down paths. For organizations looking to create engaging, highly interactive dashboards for non-financial stakeholders, Hyperion may feel restrictive and uninspiring.
4. High Total Cost of Ownership
Hyperion systems generally come with a high total cost of ownership (TCO) due to the licensing costs, infrastructure requirements, and the specialized staff needed to manage the system. Additionally, changes in business logic or reporting requirements often require expensive consulting engagements or in-house development time, making ongoing maintenance costly. For many organizations, the high TCO is no longer justified given the availability of more cost-effective, cloud-native BI solutions that provide similar or superior functionality with lower overhead.
5. Limited Cloud-Native Capabilities
Although Oracle has made efforts to transition Hyperion applications to the cloud, many deployments remain on-premises, and the transition path to the cloud can be complex and costly. Hyperion dashboards are not inherently designed as cloud-native applications, which means they do not easily take advantage of the scalability, elasticity, and lower infrastructure management overhead that true SaaS BI platforms provide. This limits the organization's ability to scale quickly, reduce infrastructure costs, and enable remote collaboration easily across the organization.
6. Slow Development Cycles
Because of its architectural complexity, developing new dashboards or modifying existing reports in Hyperion can be a slow process, often requiring significant development and testing cycles. Business users needing new metrics or KPIs frequently must submit requests that get queued in IT, delaying the delivery of insights. In contrast, modern BI platforms allow users to build and customize dashboards independently, speeding up insights and encouraging experimentation with data.
7. Challenges with Integrating Diverse Data Sources
Hyperion dashboards are primarily geared toward financial data and often work best when connected with Oracle and related systems. Integrating data from diverse cloud applications, operational databases, IoT devices, and external APIs can require additional ETL processes and middleware, adding complexity and slowing down access to unified insights. Organizations with diverse data ecosystems may find Hyperion limiting in their pursuit of comprehensive, unified analytics.
8. Difficulties in Enabling Broad User Adoption
Due to its technical complexity and less intuitive interface, Hyperion dashboards can face adoption challenges outside of finance and accounting teams. Business users in marketing, operations, or sales may find it challenging to navigate or derive value from Hyperion dashboards, leading to underutilization of the system despite the investment made. Modern, user-friendly dashboards tend to encourage broader organizational adoption, increasing the value derived from analytics investments.