Learning About Key Performance Indicators?
Key Performance Indicators are business metrics that are used to track an organization's performance.
Any industry, government agency, or non-profit organization needs to measure its performance on a daily, monthly or quarterly basis, and key performance indicators are those statistics that are deemed important to track in order to meet business goals or organizational objectives.
InetSoft is a business intelligence software provider who makes dashboard and reporting software that is most often used to track business performance, comparing actuals to forecast or target.
In general no software application is going to provide KPI's ready-to-use, since KPI's are metrics that are often derived from formulae that are specific to an enterprise in many cases, and in all cases the data that make up the KPI need to be mapped into the software application.
However, InetSoft's application, StyleBI, is designed to be as easy as possible to deploy and use.
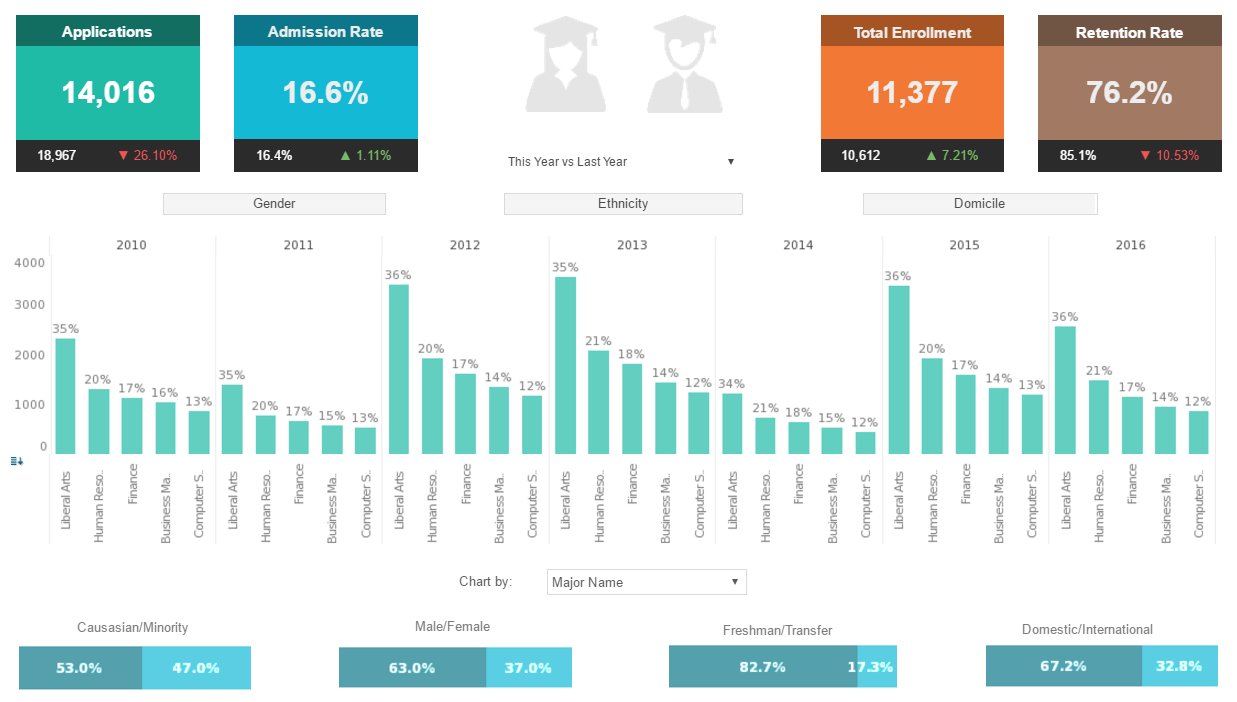
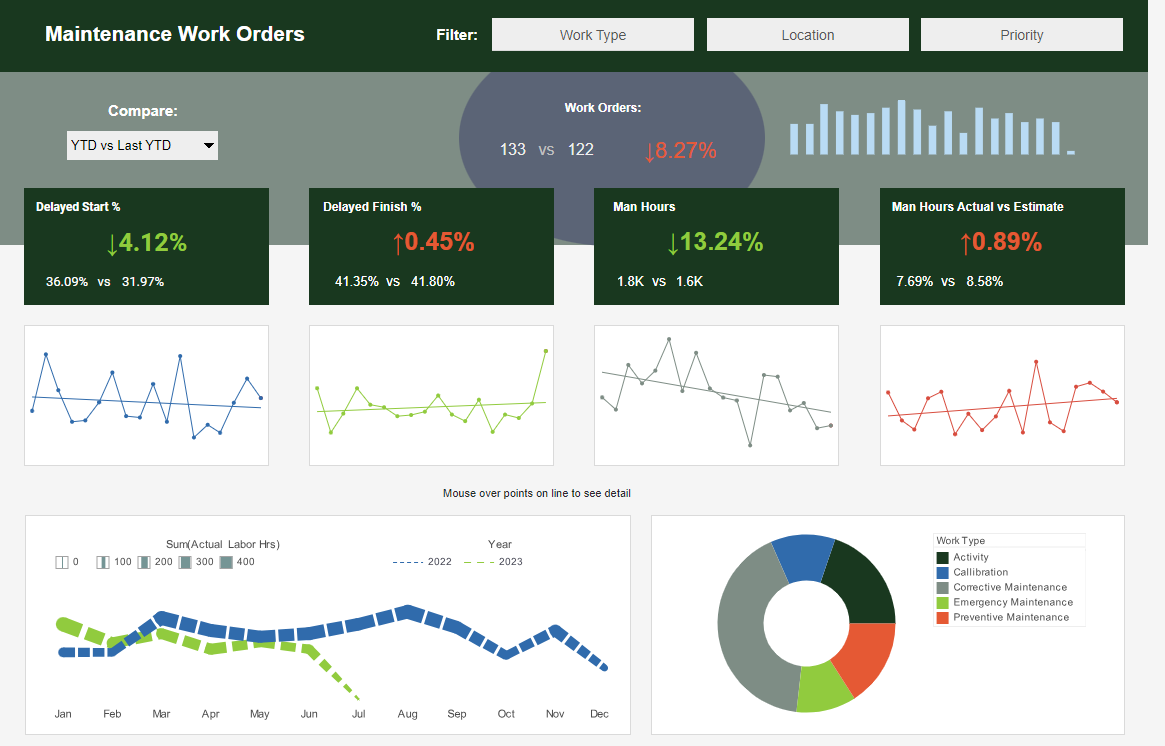
Examples of Departmental KPI's
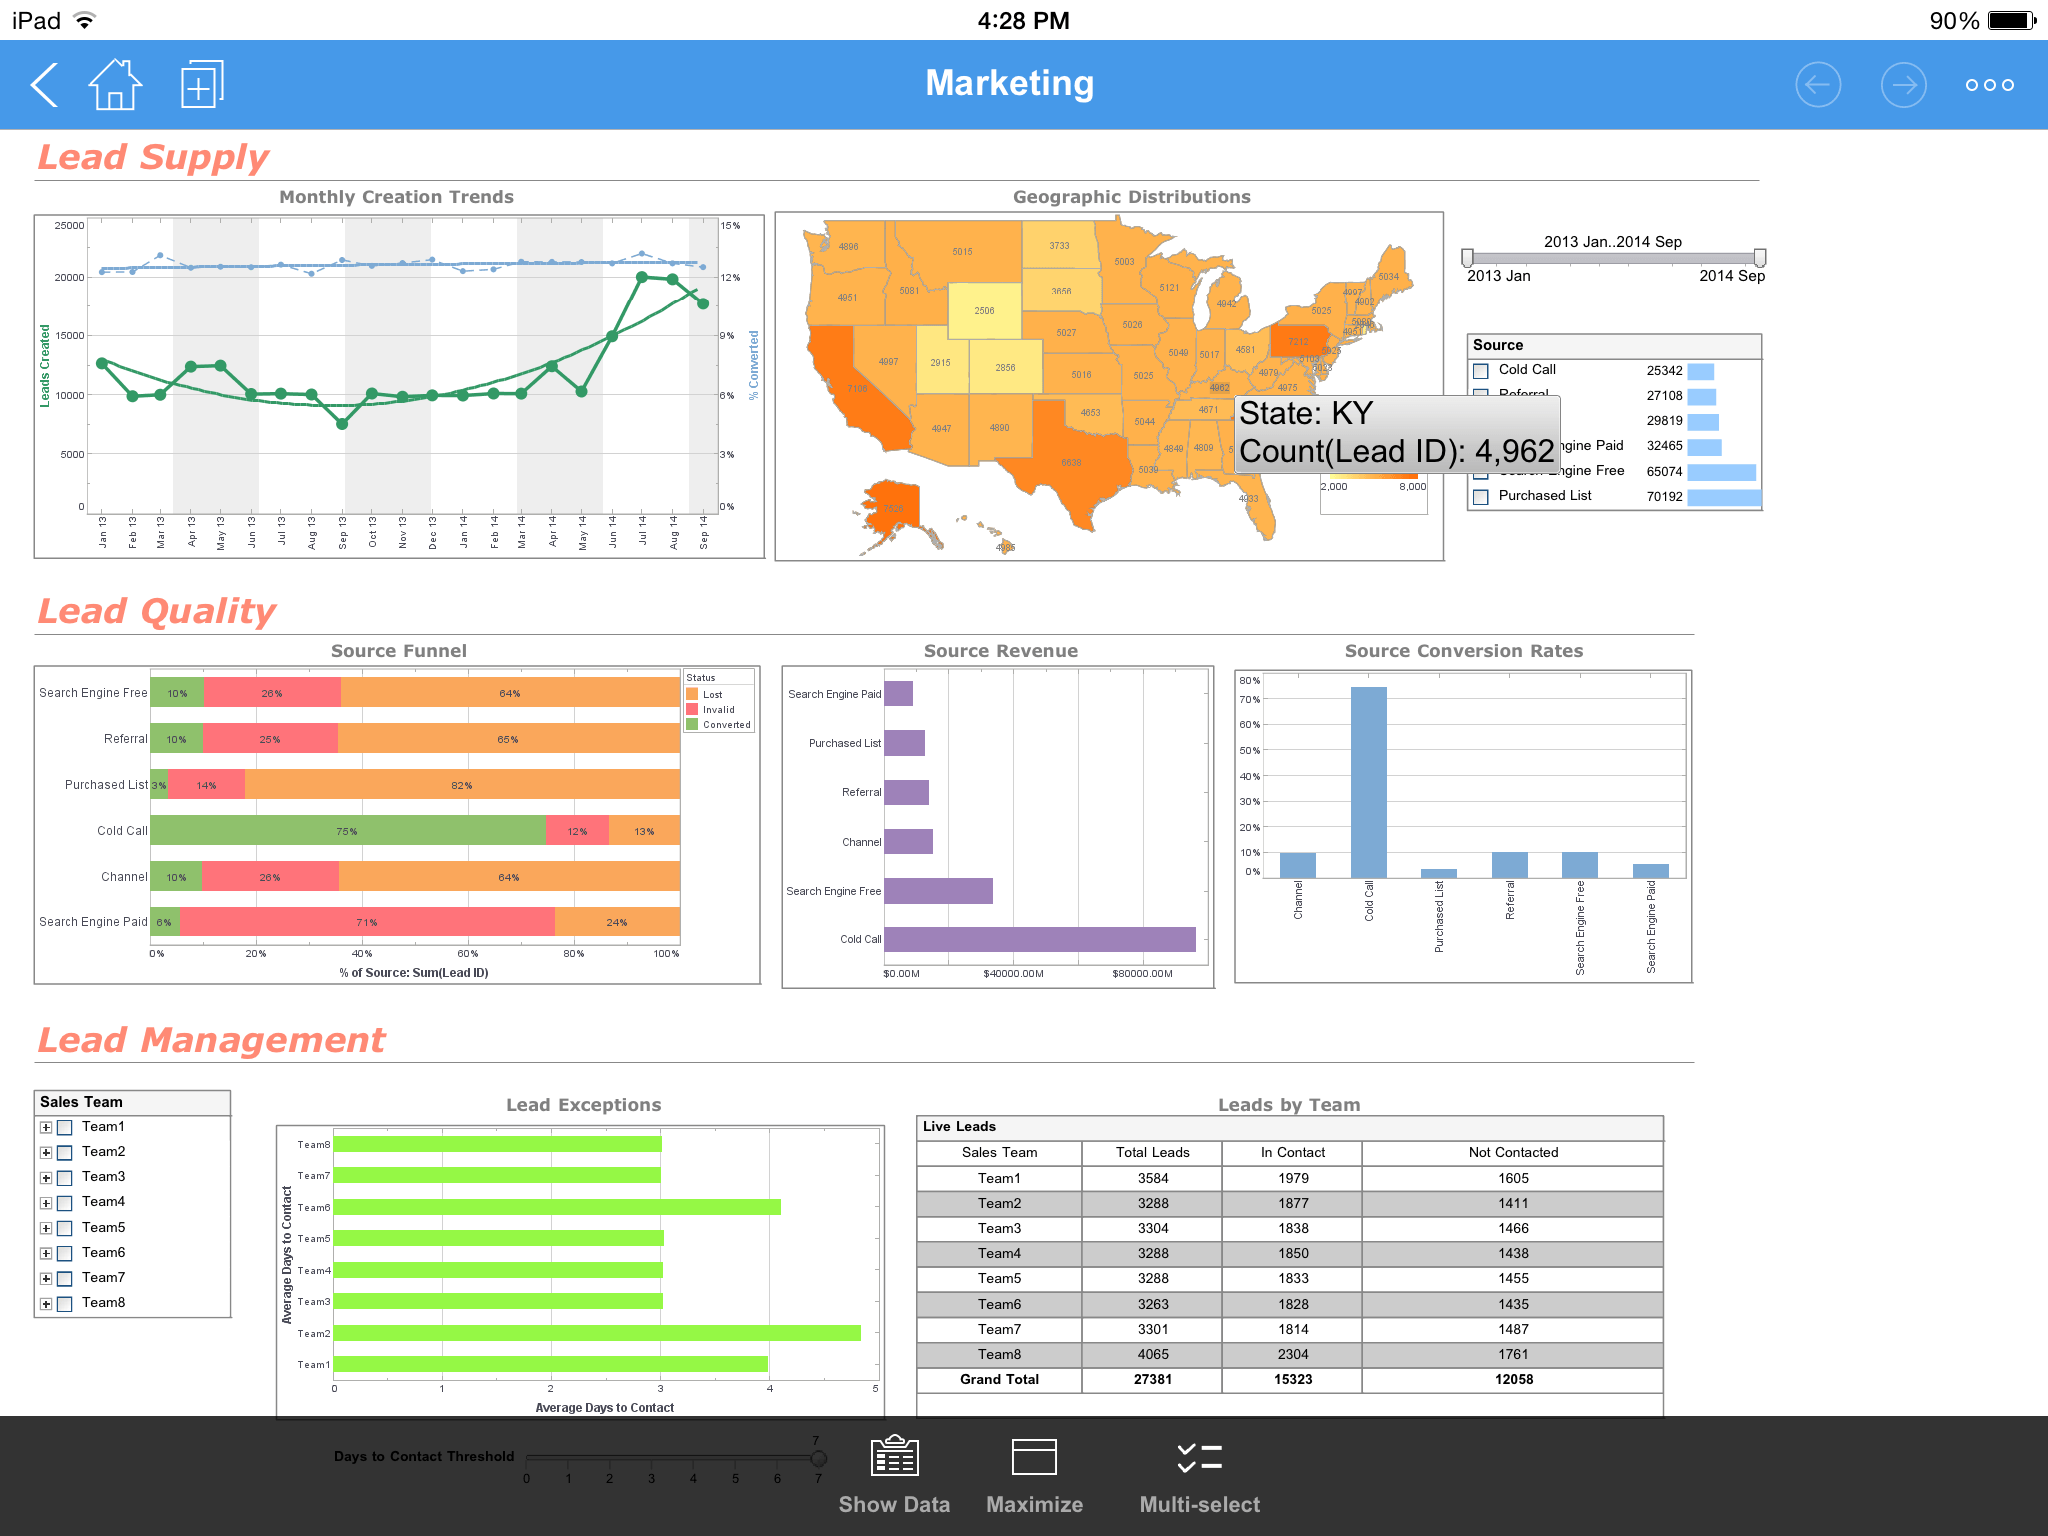
The Marketing Department of any products or services company needs to track leads as one of its KPIs. This screenshot shows the weekly count of the number of new leads generated. In addition, thanks to mutli-dimensional charting of the source of leads by colors in the vertical bars, the reasons for a KPI's increase or decrease can be seen.
The checkboxes to the right provide simple point-and-click access to filtering to explore further the reasons for change, or for slicing and dicing different campaigns, so that multiple KPIs can be tracked in a single "report." Other marketing KPIs that could be tracked are churn, conversion rates, customer value, customer profitability, CPL, CPA, and CPGA.
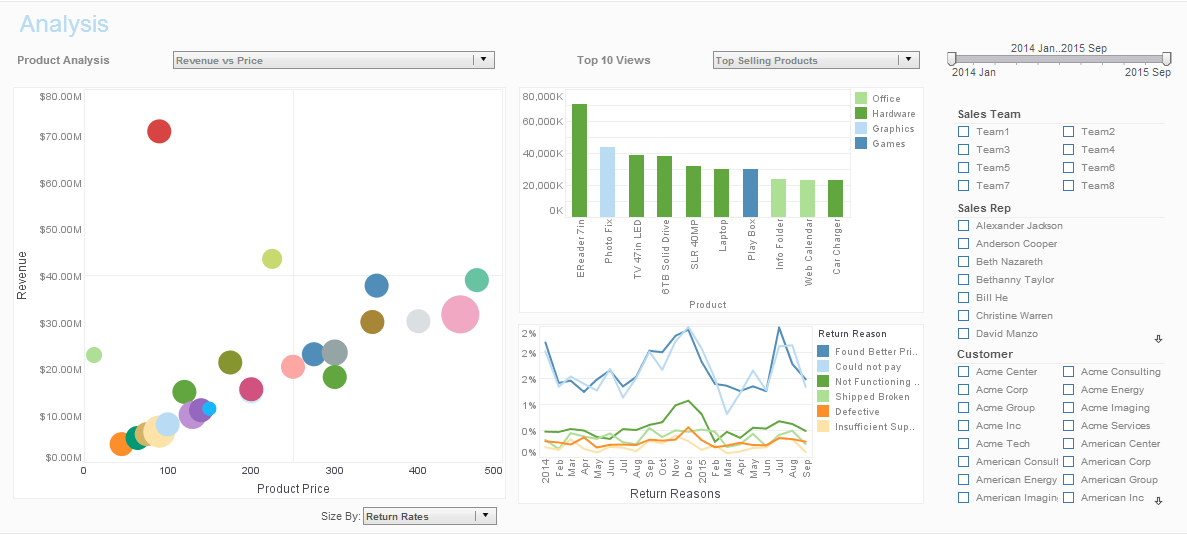
Common sales KPIs that are tracked are time to close, win rates, average deal size, sales actuals vs forecast, and quota attainment percentage.
Supply chain KPIs include turnover, efficiency, out-of-stock performance, shrinkage rates, number of weeks of supply, and average order lead time.
Popular HR KPIs include average number of training hours per employee, staff turnover, average training costs per employee, and HR FTE to total FTE ratio.
Logistics KPIs include order cycle time, order accuracy, number of shipments, transit time, warehousing cost and cost per delivery.
No function has more KPIs than Finance, and examples include cost of goods sold (COGS), operating margin, net change in cash, revenue per employee, earnings before interest and taxes (EBIT), debtor days, and forecast accuracy of budget.
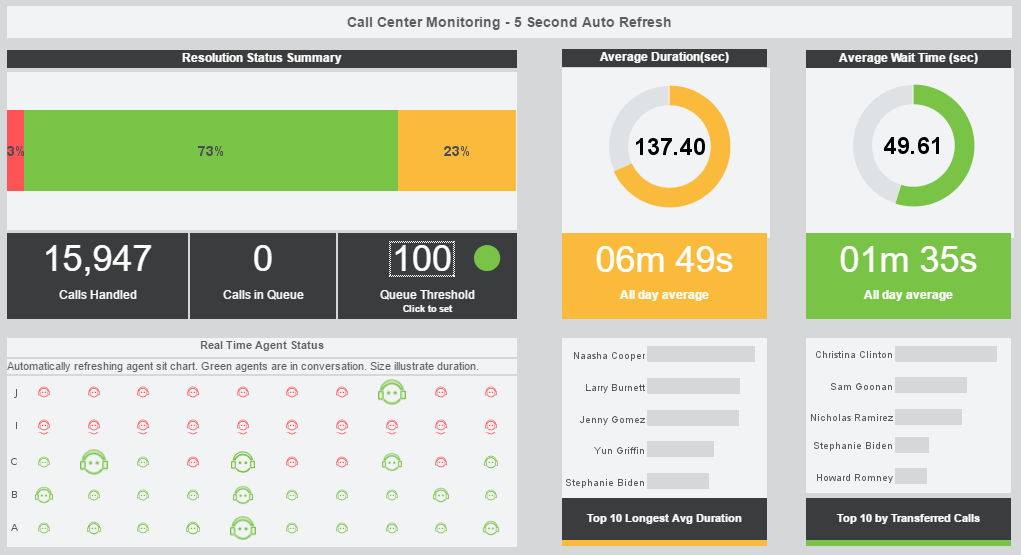
In customer service, there is customer, satisfaction improvement, retention rate, resolution time, first-call resolution rate, calls handled per rep, average handle time, complaint escalation rate, and average wait time.
What KPIs Are Used in Precision Farming?
Precision farming, also known as precision agriculture, relies on advanced technologies to optimize crop yields, reduce waste, and enhance overall efficiency in agricultural practices. Key Performance Indicators (KPIs) in precision farming help farmers monitor and assess various aspects of their operations. Some crucial KPIs in precision farming include:
-
Yield Monitoring: Tracking and analyzing crop yields per acre or hectare provide insights into the effectiveness of farming practices. This KPI helps farmers understand variations in yield across different areas of the field.
-
Crop Health and Stress Monitoring: Utilizing sensors and imaging technologies to monitor crop health indicators, such as chlorophyll levels and temperature stress, helps identify potential issues early on. This contributes to proactive pest and disease management.
-
Soil Health Metrics: Assessing soil moisture levels, nutrient content, and composition helps optimize irrigation and fertilization strategies. Healthy soil is essential for robust plant growth and optimal yield.
-
Precision Irrigation Efficiency: Monitoring water usage through precision irrigation systems helps farmers optimize water resources. KPIs include water application rates, irrigation scheduling accuracy, and overall water use efficiency.
-
Weather and Climate Impact: Tracking weather conditions and their impact on farming operations is crucial. KPIs may include the number of growing degree days, frost events, and other weather-related variables that influence crop growth.
-
Equipment Utilization and Efficiency: Monitoring the usage of farm machinery, such as tractors and harvesters, helps assess operational efficiency. KPIs include equipment downtime, fuel consumption rates, and overall machinery utilization.
-
Satellite Imagery and NDVI (Normalized Difference Vegetation Index): Analyzing satellite imagery and NDVI values provides insights into crop health, growth patterns, and potential yield variations across a field.
-
Precision Planting Accuracy: Assessing the accuracy of planting operations, including seed placement and spacing, helps optimize plant populations and promote uniform crop emergence.
-
Resource Optimization: Evaluating the use of resources, such as seeds, fertilizers, and pesticides, helps farmers minimize input costs while maximizing yield. KPIs in this category include input use efficiency and cost per unit of production.
-
Data Integration and Analysis: The ability to integrate data from various sources, such as sensors, GPS systems, and farm management software, is a critical KPI. Efficient data analysis enables informed decision-making for better farm management.
More Articles About KPI Reporting
Emergency Incident Severity KPIs - Incident severity is one of the most important KPIs in emergency management. This KPI is essential for evaluating the seriousness of the problem and figuring out how much action is needed. There are certain measures for determining the intensity of different sorts of emergencies...
Heating Equipment Health and Performance - Numerous pieces of apparatus and equipment are essential to numerous heat management procedures. Heat exchangers, pumps, coolers, and heaters are a few examples of these. Ensuring the overall effectiveness of the system requires regular monitoring of the performance and health of these components...
Using Data Analytics For Rail Safety - An expert big data and cloud computing says that data analytics have been used to improve rail safety in more ways than one. Developers have focused greatly on sensors and real-time GPS tracking units and other hardware that monitors all railroads and tries to mitigate safety concerns. He cites an example here, "there is a system that operates on radio frequencies to provide a...
Why Are IoT Dashboards Created? - Building IoT dashboards is done for a number of purposes, including: Automatically add location, time, weather, temperature, and other external elements specific to your consumers to incoming data from your equipment; Users and operators may (remotely) monitor and manage certain assets and processes with the aid of IoT Dashboards, and depending on safety standards, they can access and operate an environment from anywhere in the globe...
