Learning about Key Performance Measures?
Key performance measures (KPMs) are business metrics that are used to track an organization's performance. Any industry, government agency, or non-profit organization needs to measure its performance on a daily, monthly or quarterly basis, and key performance measures are those statistics that are deemed important to track in order to meet business goals or organizational objectives.
InetSoft is a business intelligence software provider who makes business metric dashboard and reporting software that is most often used to track business performance, comparing actuals to forecast or target.
In general no software application is going to provide KPMs ready-to-use, since KPMs are metrics that are often derived from formulae that are specific to an enterprise in many cases, and in all cases the data that make up the KPM need to be mapped into the software application.
However, InetSoft's StyleBI is designed to be as easy as possible to deploy and use.

Examples of KPM's
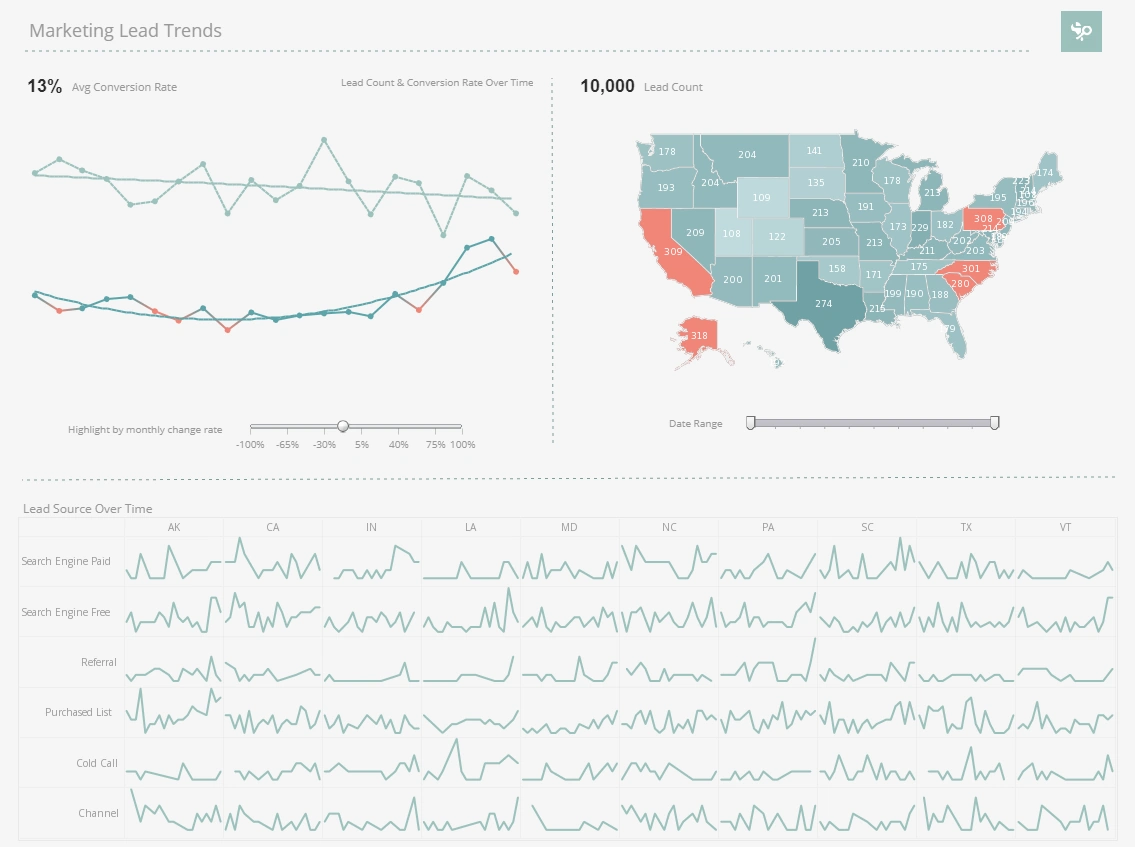
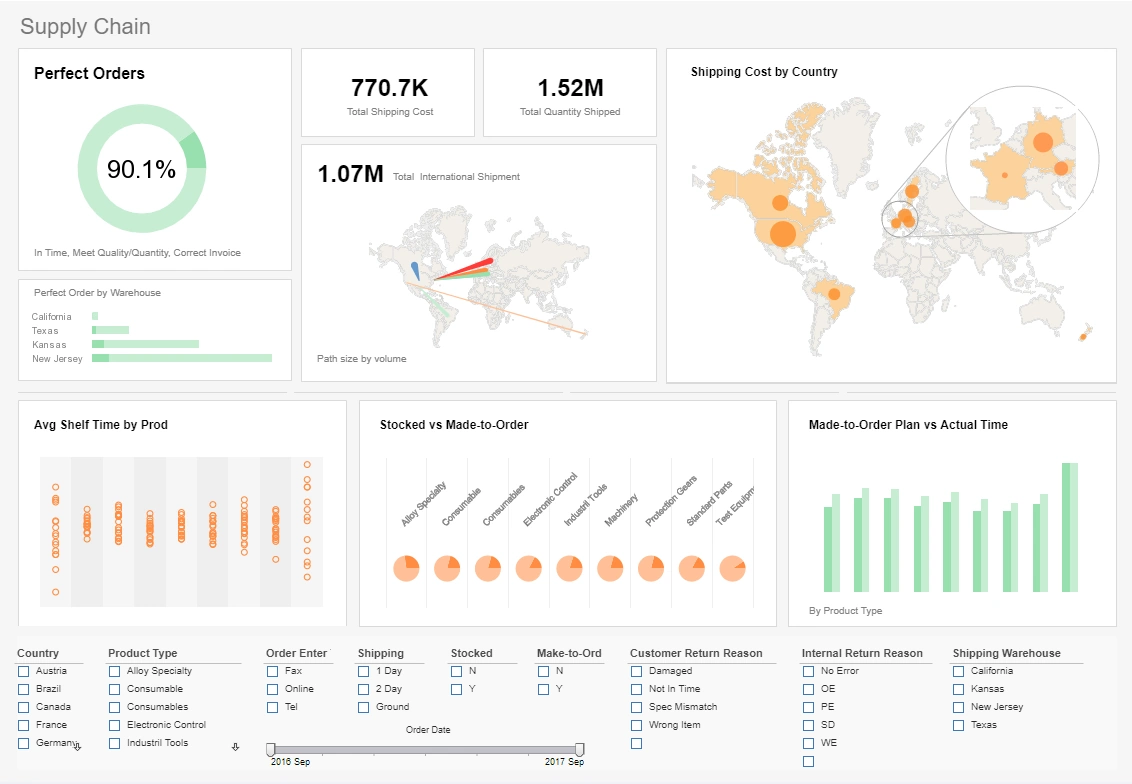
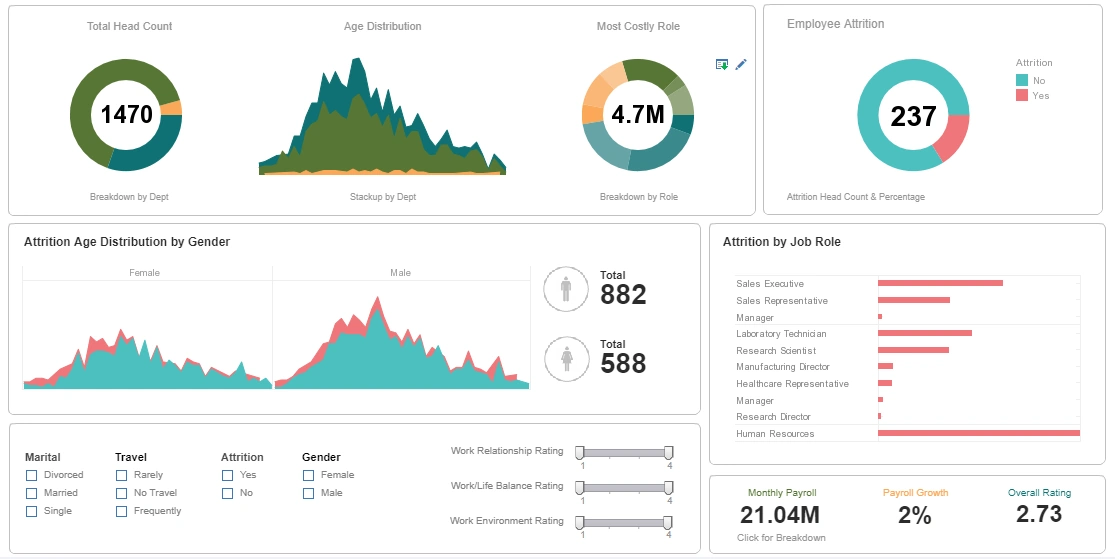
To visualize how some common KPM's can be charted and analyzed in InetSoft's application look at the examples to the left.
The Marketing Department of any products or services company needs to track leads as one of its KPMs. This screenshot shows the weekly count of the number of new leads generated. In addition, thanks to mutli-dimensional charting of the source of leads by colors in the vertical bars, the reasons for a KPM's increase or decrease can be seen. The checkboxes to the right provide simple point-and-click access to filtering to explore further the reasons for change, or for slicing and dicing different campaigns, so that multiple KPMs can be tracked in a single "report."
Other marketing KPMs that could be tracked are churn, conversion rates, customer value, customer profitability, CPL, CPA, and CPGA. Common sales KPMs that are tracked are time to close, win rates, average deal size, sales actuals vs forecast, and quota attainment percentage.
Supply Chain KPMs >include turnover, efficiency, out-of-stock performance, shrinkage rates, number of weeks of supply, and average order lead time.
Popular HR KPMs include average number of training hours per employee, staff turnover, average training costs per employee, and HR FTE to total FTE ratio.
No function has more KPMs than Finance, and examples include cost of goods sold (COGS), operating margin, net change in cash, revenue per employee, earnings before interest and taxes (EBIT), debtor days, and forecast accuracy of budget.
In operations and supports centers run by information technology departments, common measures are percentage of actual uptime (in hours) of equipment relative to the total numbers of planned uptime (in hours), mean-time between failure (MTBF), which is the average time between equipment failures over a given period i.e. the average time a device will function before failing, and first-call resolution rate, which is the percentage of customer issues that were solved by the first phone call.
Manufacturers track average time to produce, defect rates, output per man hour, accidents per month, and machine downtime.
What Key Performance Measures Are Used on Customer Interaction Management Dashboards?
Customer Interaction Management (CIM) dashboards play a crucial role in monitoring and improving customer interactions across various channels. The key performance measures on CIM dashboards help organizations assess the effectiveness of their customer service and engagement efforts. Here are common key performance measures used on Customer Interaction Management dashboards:
- Customer Satisfaction (CSAT):
- CSAT Score: Measure of customer satisfaction based on post-interaction surveys or feedback.
- CSAT Trends: Tracking changes in CSAT scores over time to identify patterns and areas for improvement.
- Net Promoter Score (NPS):
- NPS Rating: Calculating the NPS based on the likelihood of customers recommending the company.
- NPS Trends: Monitoring changes in NPS scores to gauge overall customer loyalty and advocacy.
- Customer Feedback and Sentiment Analysis:
- Sentiment Scores: Analyzing customer interactions to determine sentiment (positive, neutral, negative).
- Customer Comments: Reviewing qualitative feedback to understand specific customer concerns and suggestions.
- First Contact Resolution (FCR):
- FCR Rate: Percentage of customer interactions resolved on the first contact.
- Reasons for Recontact: Analyzing reasons for customer recontacts to address underlying issues.
- Average Handling Time (AHT):
- AHT Trends: Monitoring the average time taken to handle customer interactions.
- AHT Breakdown: Analyzing AHT components, such as talk time, hold time, and after-call work.
- Service Level and Response Time:
- Service Level Agreement (SLA) Compliance: Ensuring compliance with predefined service level agreements.
- Response Time Metrics: Measuring the time taken to respond to customer inquiries or requests.
- Channel-Specific Metrics:
- Response Time by Channel (e.g., Phone, Email, Chat): Analyzing response times across different communication channels.
- Channel Utilization: Assessing the popularity and effectiveness of each communication channel.
- Customer Retention and Churn:
- Customer Retention Rate: Calculating the percentage of customers retained over a specific period.
- Churn Rate: Measuring the rate at which customers discontinue their interactions with the company.
- Resolution Rate by Interaction Type:
- Resolution Rate for Inquiries, Complaints, etc.: Evaluating the success of resolving different types of customer interactions.
- Issue Categories: Categorizing customer issues to identify common themes and areas for improvement.
- Agent Performance Metrics:
- Agent Efficiency and Productivity: Analyzing the productivity of customer service agents.
- Agent Satisfaction: Measuring agent satisfaction to assess the impact on customer interactions.
- Self-Service Usage and Effectiveness:
- Self-Service Adoption: Tracking the adoption rate of self-service options (e.g., FAQs, knowledge base).
- Self-Service Resolution Rate: Measuring the effectiveness of self-service in resolving customer issues.
- Customer Journey Analytics:
- Customer Journey Mapping: Visualizing and analyzing the various touchpoints in the customer journey.
- Conversion Rates at Each Stage: Monitoring conversion rates at different stages of the customer journey.
- Customer Segmentation Metrics:
- Segmented CSAT and NPS Scores: Analyzing satisfaction and loyalty scores for different customer segments.
- Segment-Specific Interaction Patterns: Understanding how different customer segments prefer to interact.
- Compliance and Quality Assurance:
- Compliance Metrics: Ensuring that customer interactions adhere to regulatory and compliance standards.
- Quality Assurance Scores: Assessing the quality of interactions through QA evaluations.

More Articles About KPMs
Analytics in Real Estate for Smart Investments - Real estate is an industry that requires you to constantly invest in order to profit. Smart investments are among the top priorities in the real estate industry, and analytics are helping investors make smarter choices. Today, people are using analytics to ensure their investments are going to work great. They're analyzing: property location the best type of property at a certain location...
Key Performance Indicators Dashboard Solution Articles - Are you investigating key performance indicators dashboard solutions? InetSoft offers performance management software for dashboards and scorecards that can be easily deployed and used. Read articles below about performance management topics and the features and benefits of InetSoft's KPI tools...
Teacher Performance Metrics - KPIs for teacher performance monitor how well instructors are doing in the classroom. Common key performance indicators for teachers include: a) Student assessments: From the viewpoint of the students, student evaluations gauge the performance and pleasure of instructors. b) Teacher Attendance Rate: This statistic represents the proportion of instructors who routinely show up for work...
Vendor Relationship Management Metrics - Vendor Satisfaction Surveys: Understanding how satisfied a vendor is with their complete experience may be learned via measuring vendor satisfaction. Surveys and other forms of feedback may be used to pinpoint problem areas and encourage cooperation. Relationship Health: Analyzing aspects like communication efficacy, problem resolution speed, and business purpose alignment is necessary to assess the general health of vendor relationships...