KPI Threshold Violations: Detecting and Acting on Performance Exceptions
Organizations depend on key performance indicators (KPIs) to measure progress toward strategic goals. While monitoring KPIs is important, identifying KPI threshold violations is even more critical because these events signal that a metric has moved outside an acceptable range. A violation can indicate an operational problem, revenue risk, customer service issue, compliance concern, or other condition requiring immediate attention.
Modern business intelligence platforms such as StyleBI help organizations automatically detect threshold violations, alert stakeholders, and provide the visual analytics needed to investigate root causes before problems escalate.

What Is a KPI Threshold Violation?
A KPI threshold violation occurs when a metric exceeds or falls below a predefined target, limit, or acceptable operating range. Thresholds are established to indicate healthy performance and help teams respond quickly when conditions change.
Examples include:
- Customer satisfaction drops below 90%.
- Daily revenue falls beneath a minimum target.
- Inventory levels decline below safety stock requirements.
- Manufacturing defect rates exceed acceptable limits.
- Website response times rise above performance standards.
Rather than requiring managers to review every report manually, threshold monitoring highlights only the metrics that require attention.
Why KPI Threshold Violations Matter
Business leaders cannot effectively monitor hundreds of metrics simultaneously. KPI threshold management helps organizations focus on exceptions and prioritize actions based on business impact.
Benefits include:
- Faster identification of emerging problems.
- Reduced operational risk.
- Improved accountability.
- More efficient decision-making.
- Greater alignment with strategic objectives.
- Earlier intervention before performance worsens.
Common Types of Threshold Violations
Upper Limit Violations
These occur when a KPI exceeds a maximum acceptable value. For example, customer support ticket backlog volume rising above a specified threshold.
Lower Limit Violations
These occur when performance falls below minimum expectations, such as sales revenue missing monthly goals.
Variance-Based Violations
Some organizations define thresholds based on deviations from forecasts, budgets, or historical averages.
Trend Violations
A KPI may remain within limits while showing a concerning trend that predicts a future threshold breach.
Monitoring KPI Threshold Violations with StyleBI
StyleBI provides interactive dashboards that help business users monitor KPIs in real time. Conditional formatting, scorecards, gauges, alerts, and visual indicators immediately highlight metrics that breach predefined thresholds.
Instead of reviewing multiple reports, managers can access a single dashboard displaying critical KPIs, current performance status, historical trends, and contributing factors. When a threshold violation occurs, users can drill down into operational data to determine the source of the issue.
StyleBI capabilities include:
- Real-time KPI monitoring.
- Exception-based dashboards.
- Automated alerts and notifications.
- Interactive drill-down analysis.
- Visual scorecards and KPI status indicators.
- Enterprise-wide performance visibility.

Real-World Use Case: Retail Inventory Management
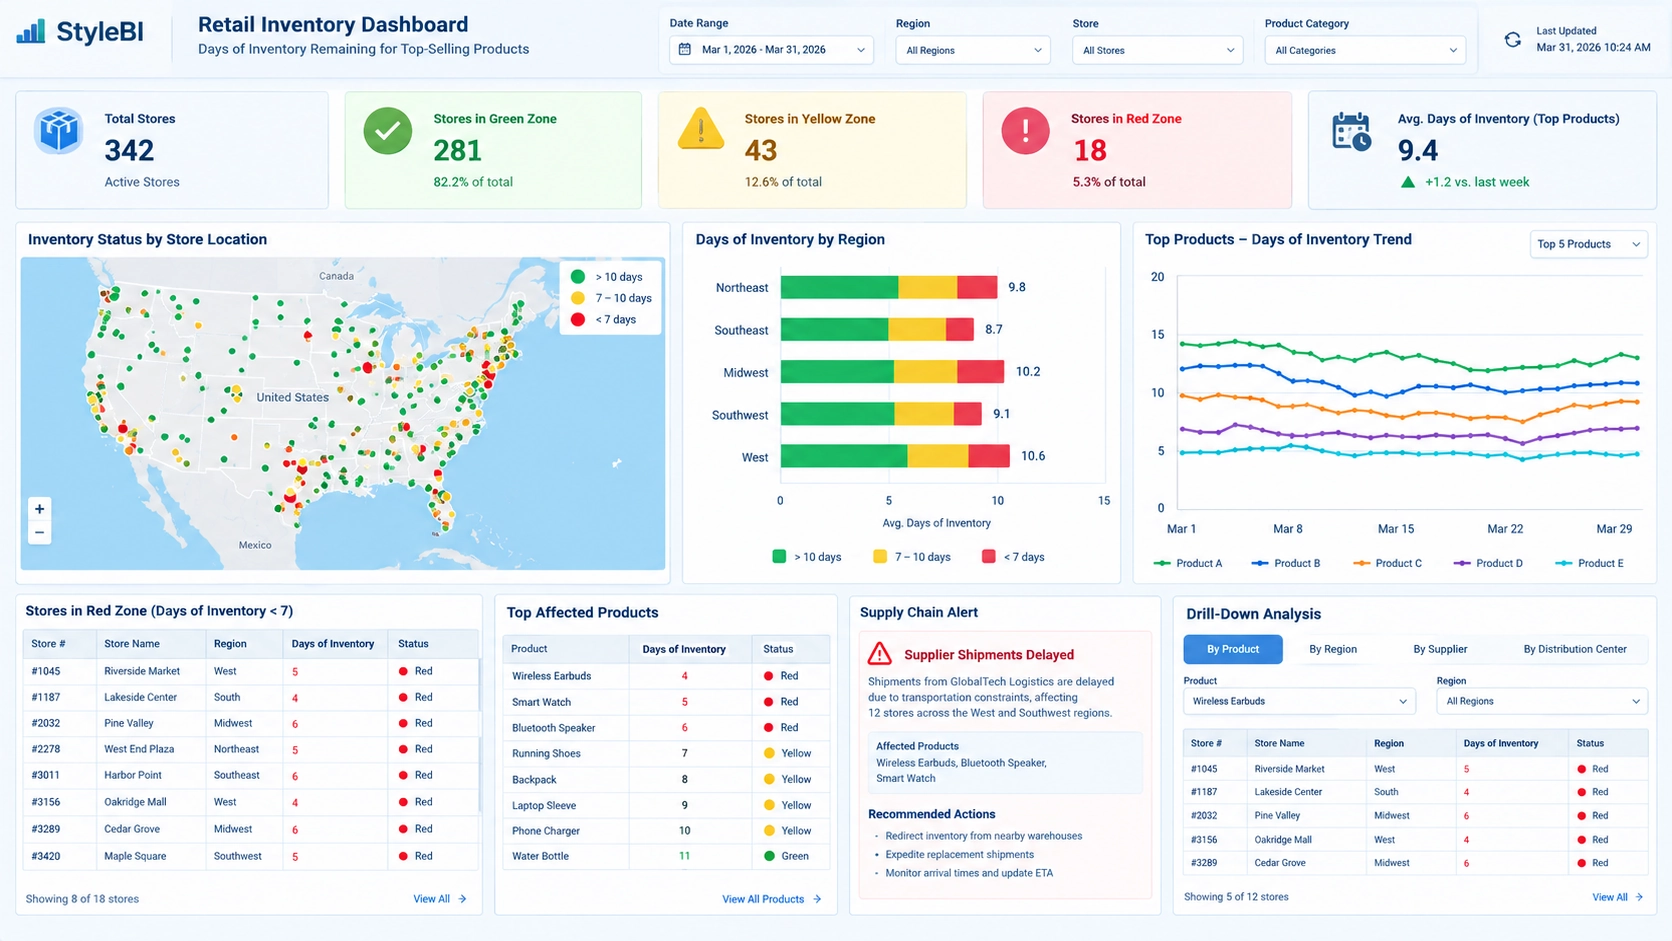
A national retail chain operates hundreds of stores and relies on continuous inventory availability to meet customer demand. The company establishes a KPI that measures days of inventory remaining for its highest-selling products.
Management defines a threshold requiring at least seven days of inventory for all critical items. If inventory levels fall below this threshold, stockout risk increases significantly.
Using a StyleBI dashboard, inventory managers monitor inventory KPIs across all regions. The dashboard displays inventory status using color-coded indicators:
- Green: More than 10 days of inventory.
- Yellow: Between 7 and 10 days of inventory.
- Red: Below 7 days of inventory.
During a seasonal demand surge, the dashboard identifies multiple stores that have fallen into the red zone. Automated alerts notify inventory planners immediately.
Managers use StyleBI's drill-down capabilities to identify affected products, regions, suppliers, and distribution centers. Analysis reveals that shipments from a particular supplier are delayed due to transportation constraints.
Armed with this information, planners redirect inventory from nearby warehouses and expedite replacement shipments. As a result, the organization avoids stockouts, protects revenue, and maintains customer satisfaction.

Best Practices for Managing KPI Threshold Violations
- Define thresholds based on business objectives and operational realities.
- Review thresholds regularly as conditions change.
- Prioritize KPIs with significant business impact.
- Use automated alerts to reduce response times.
- Provide drill-down access for root cause analysis.
- Track recurring violations to identify systemic issues.
- Assign ownership for each monitored KPI.
Focusing Attention on Exceptions
KPI threshold violations serve as an early warning system for organizations seeking to improve performance and reduce risk. By focusing attention on exceptions rather than routine activity, businesses can respond faster and make better decisions.
With StyleBI, organizations can monitor KPIs in real time, receive alerts when thresholds are breached, investigate root causes through interactive analytics, and take corrective action before minor issues become major business problems.