What Are Leading and Lagging KPI Examples?
Organizations use key performance indicators (KPIs) to measure progress toward business goals. One of the most important concepts in performance management is understanding the difference between leading KPIs and lagging KPIs. While both are valuable, they serve different purposes. Leading KPIs help predict future outcomes and support proactive decision-making. Lagging KPIs measure results that have already occurred and help determine whether goals were achieved.
The most effective performance management strategies combine both types of KPIs. Leading indicators provide early warning signs and opportunities for improvement, while lagging indicators confirm whether those actions produced the desired results. Businesses that monitor both can react faster, improve accountability, and make better strategic decisions.

What Is a Leading KPI?
A leading KPI measures activities, behaviors, or trends that are likely to influence future business outcomes. These indicators are predictive in nature and help managers identify potential opportunities or problems before final results are known.
Leading KPIs are especially useful because they support proactive management. Rather than waiting for a quarterly report to reveal issues, organizations can monitor leading metrics continuously and make adjustments in real time.
Common characteristics of leading KPIs include:
- Predict future performance
- Provide early warning signals
- Support preventive action
- Measure activities rather than outcomes
- Often updated frequently
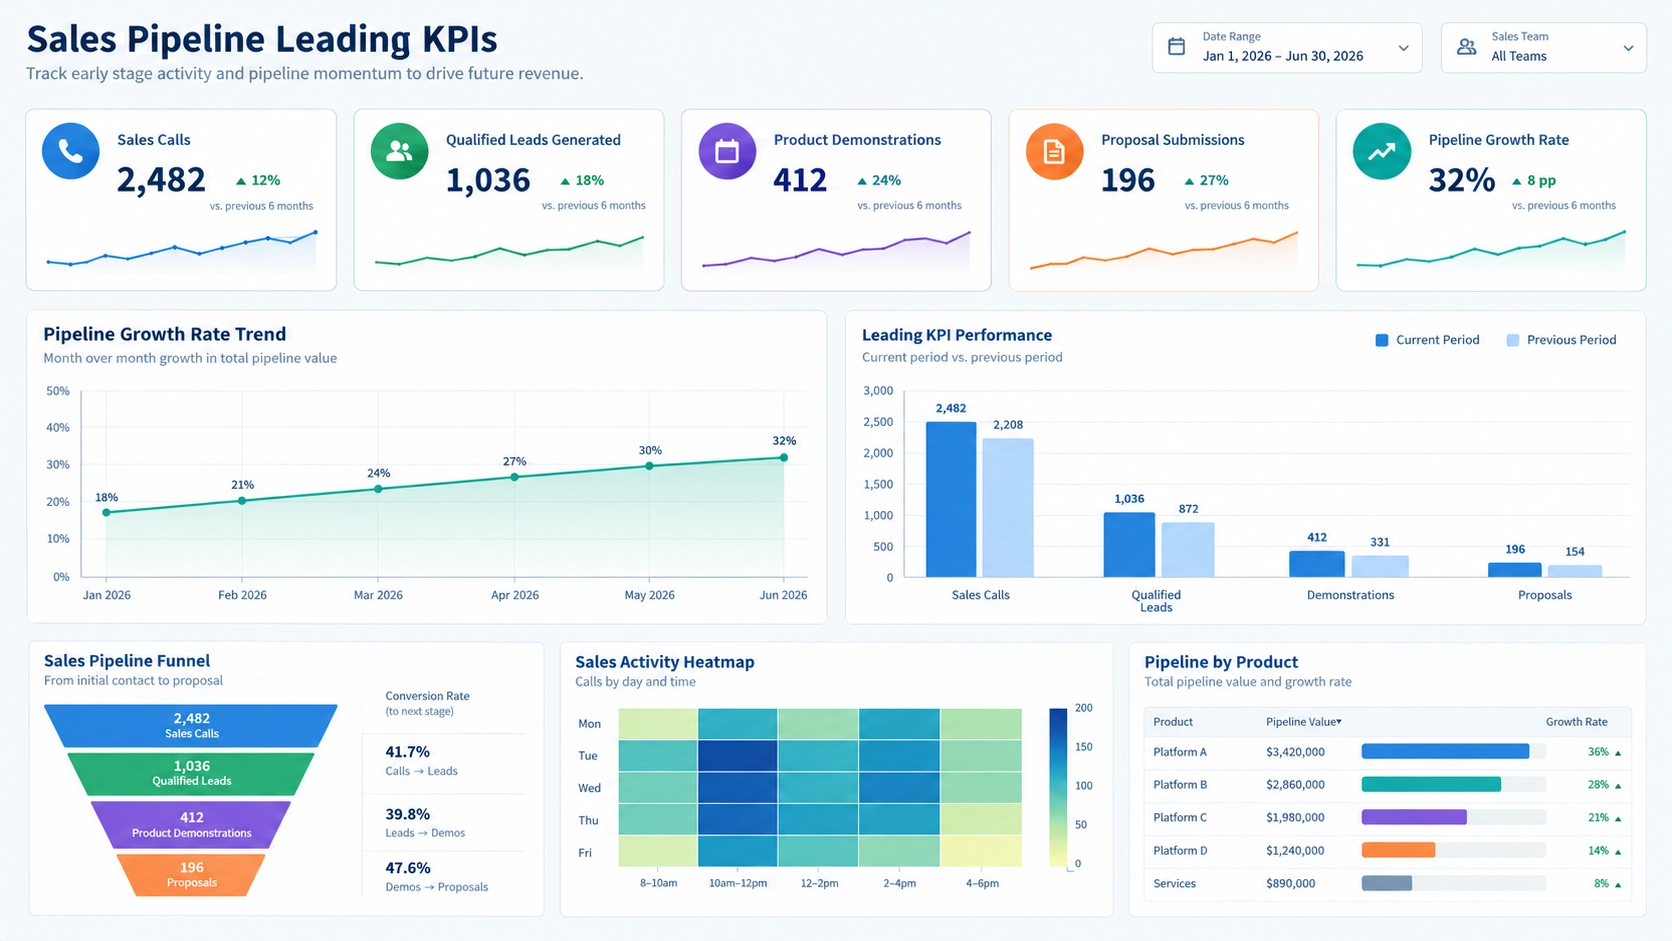
For example, the number of sales calls made by representatives is a leading KPI because increased sales activity may result in higher future revenue. Similarly, employee training hours may predict future productivity improvements.
What Is a Lagging KPI?
A lagging KPI measures outcomes that have already occurred. These indicators are retrospective and answer the question, "What happened?" They are often used to evaluate the success of strategies, projects, departments, or entire organizations.
Because lagging KPIs represent completed performance, they are generally easier to measure and verify than leading indicators. However, they do not provide much opportunity to change outcomes that have already occurred.
Common characteristics of lagging KPIs include:
- Measure completed results
- Evaluate business performance
- Support accountability
- Confirm achievement of goals
- Provide historical analysis
For example, total quarterly revenue, net profit, customer retention rate, and annual market share are all lagging KPIs because they measure results after they have happened.
Leading vs. Lagging KPIs
The distinction between leading and lagging KPIs can be summarized with a simple question: Does the metric predict a future outcome or measure a completed result?
Both types are necessary. Relying only on lagging KPIs is like driving while looking exclusively in the rear-view mirror. Relying only on leading KPIs may create activity without confirming actual business success.
Examples of Leading and Lagging KPIs by Business Function
Sales
Sales organizations frequently use both predictive and outcome-based metrics.
Leading KPI Examples:
- Number of sales calls
- Qualified leads generated
- Product demonstrations scheduled
- Proposal submissions
- Pipeline growth rate
Lagging KPI Examples:
- Total revenue
- Sales growth percentage
- Closed deals
- Customer acquisition revenue
- Profit margins
Marketing
Marketing teams use leading indicators to assess campaign momentum before revenue impact becomes visible.
Leading KPI Examples:
- Website traffic
- Email open rates
- Content downloads
- Social media engagement
- Marketing qualified leads
Lagging KPI Examples:
- Marketing-generated revenue
- Customer acquisition rate
- Campaign return on investment
- Customer lifetime value
- Revenue growth
Human Resources
HR departments often track workforce development activities alongside business outcomes.
Leading KPI Examples:
- Training participation rates
- Employee engagement scores
- Time-to-hire improvements
- Internal promotion rates
- Performance review completion rates
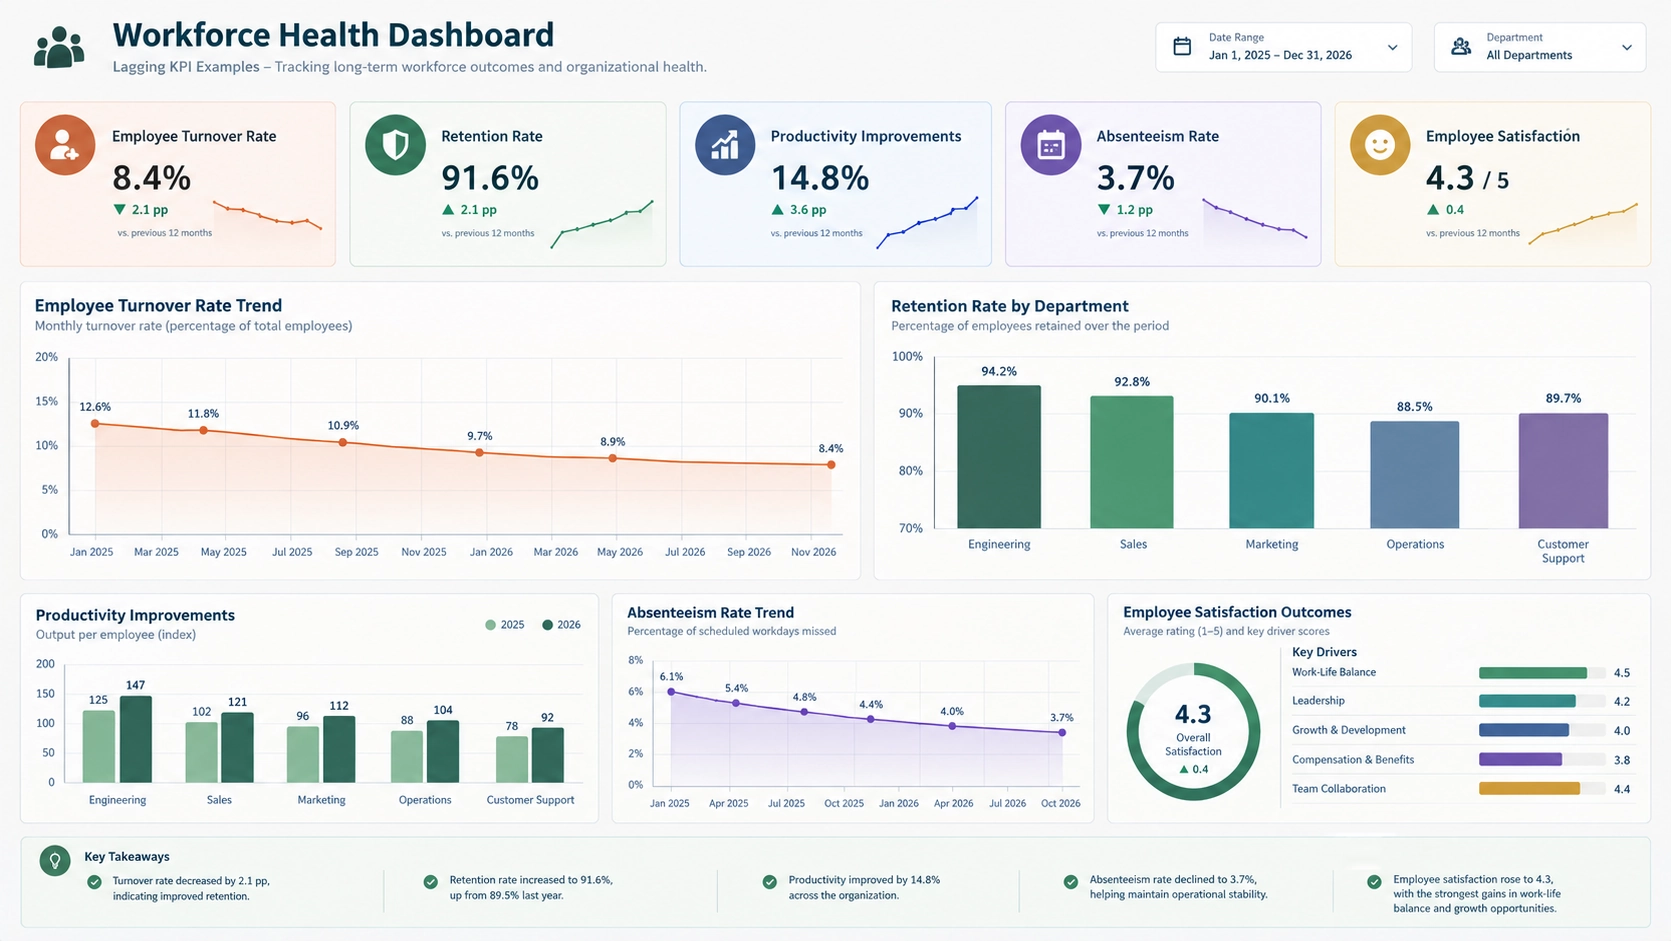
Lagging KPI Examples:
- Employee turnover rate
- Retention rate
- Productivity improvements
- Absenteeism rate
- Employee satisfaction outcomes
Manufacturing
Manufacturers rely heavily on predictive indicators to avoid costly production issues.
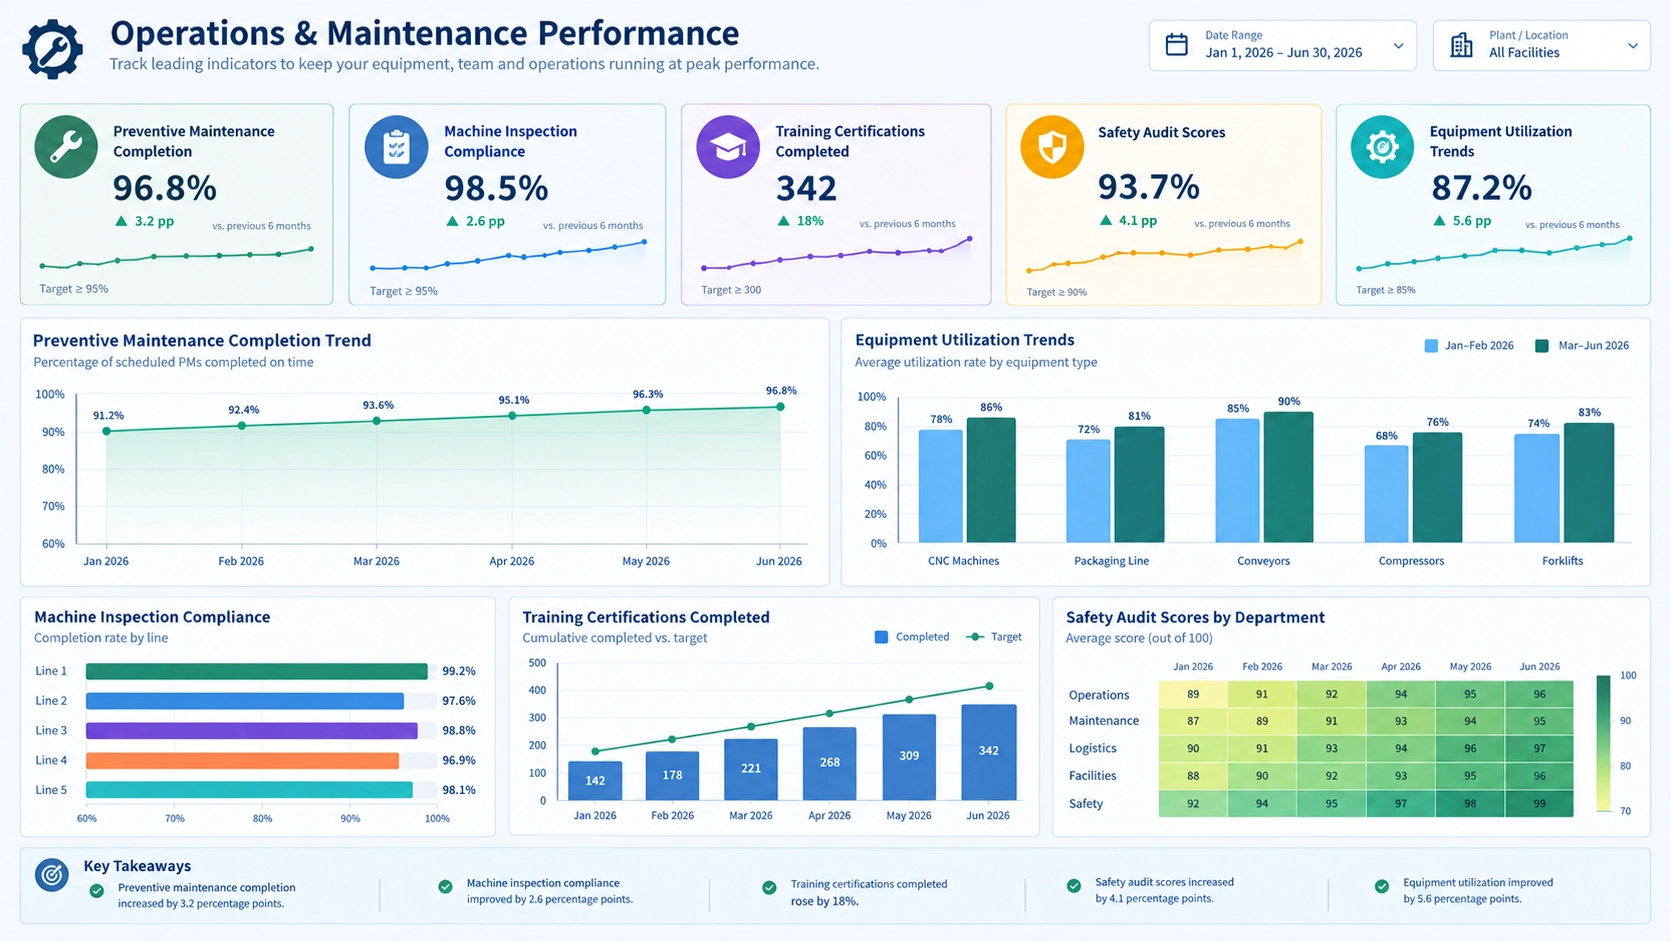
Leading KPI Examples:
- Preventive maintenance completion
- Machine inspection compliance
- Training certifications completed
- Safety audit scores
- Equipment utilization trends
Lagging KPI Examples:
- Production output
- Defect rates
- Downtime hours
- On-time delivery rate
- Manufacturing costs
How Leading KPIs Influence Lagging KPIs
The most effective KPI frameworks create direct connections between leading and lagging indicators. Managers should be able to explain how improvements in leading KPIs will eventually impact desired business outcomes.
Consider the following examples:
- Increased sales calls lead to higher revenue.
- More employee training leads to improved productivity.
- Better preventive maintenance leads to lower downtime.
- Higher website engagement leads to greater customer acquisition.
- Improved customer response times lead to stronger retention.
When dashboard users understand these relationships, performance data becomes much more actionable.
Building KPI Dashboards with Both Metrics
Modern KPI dashboards should display both leading and lagging indicators together. This approach allows executives and managers to see not only current results but also the factors that are likely to affect future performance.
A balanced dashboard might include:
- Current revenue and revenue forecast
- Closed opportunities and sales pipeline activity
- Customer retention and customer satisfaction trends
- Production output and equipment maintenance status
- Employee turnover and engagement scores
Interactive dashboard software helps organizations analyze trends, drill into underlying data, and identify relationships between predictive and outcome-based metrics.
Best Practices for KPI Selection
Selecting meaningful KPIs is as important as measuring them. Organizations should avoid tracking metrics simply because data is available. Instead, KPIs should align directly with strategic objectives.
Best practices include:
- Align KPIs with specific business goals.
- Use a combination of leading and lagging indicators.
- Limit dashboards to the most important metrics.
- Review KPI effectiveness regularly.
- Ensure data quality and consistency.
- Assign ownership for KPI monitoring and improvement.
Organizations that establish a balanced KPI framework gain deeper visibility into both performance drivers and business outcomes.
Complementary Tools for Measuring Business Performance
Leading and lagging KPIs are complementary tools for measuring business performance. Leading KPIs provide predictive insight into future results, while lagging KPIs confirm achieved outcomes. Examples of leading KPIs include sales calls, training hours, website traffic, and preventive maintenance activities. Examples of lagging KPIs include revenue, profitability, customer retention, production output, and employee turnover.
The strongest performance management systems combine both types of metrics within interactive dashboards. By monitoring leading indicators alongside lagging results, organizations can identify trends earlier, make faster decisions, and improve the likelihood of achieving strategic objectives.