Manufacturing Dashboards
Real-Time Quality, Production & OEE Insights for Modern Factories
What Is a Manufacturing Dashboard?
A manufacturing dashboard is a real-time visual system that consolidates production, quality, maintenance, and supply-chain data into a single interactive view. It helps operations teams monitor OEE, defect rates, cycle time, downtime, and other critical KPIs across machines, lines, and shifts. Manufacturing dashboards reduce decision latency, highlight bottlenecks, and enable continuous improvement across the factory floor.
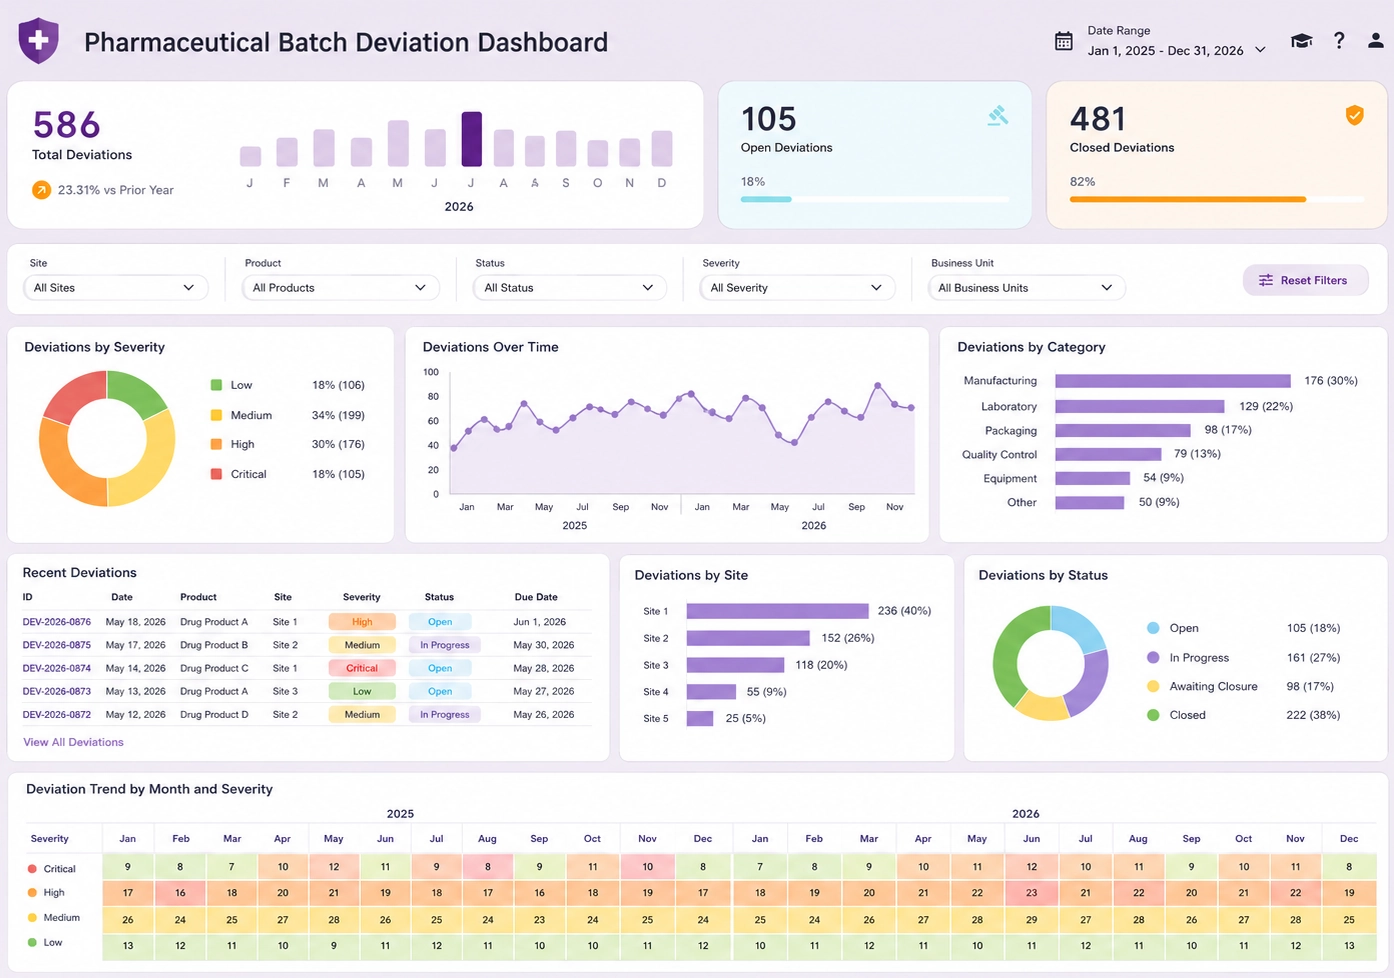

Why Manufacturing Dashboards Matter
Modern manufacturing environments generate massive volumes of data from MES, ERP, SCADA, sensors, and quality systems. A unified dashboard:
- Improves visibility across production lines
- Reduces scrap and rework
- Accelerates root-cause analysis
- Supports lean and Six Sigma initiatives
- Enables proactive maintenance
- Aligns operators, engineers, and executives around shared KPIs
Key Manufacturing Dashboard KPIs
These KPIs define the core of a high-value manufacturing dashboard:
- Overall Equipment Effectiveness (OEE) — availability, performance, and quality
- Cycle Time — time required to produce one unit
- Yield — good units vs. total units
- Defect Rate — errors per batch, shift, or machine
- Downtime — planned and unplanned stoppages
- MTBF — mean time between failures
- Energy Consumption — cost and sustainability metrics
- Inventory Turnover — flow of materials through production
Manufacturing Dashboard Use Cases and Templates
- Production Efficiency Template — throughput, cycle time, bottlenecks
- OEE Monitoring Template — availability, performance, quality
- Quality Control Template — FPY, defect rates, SPC charts
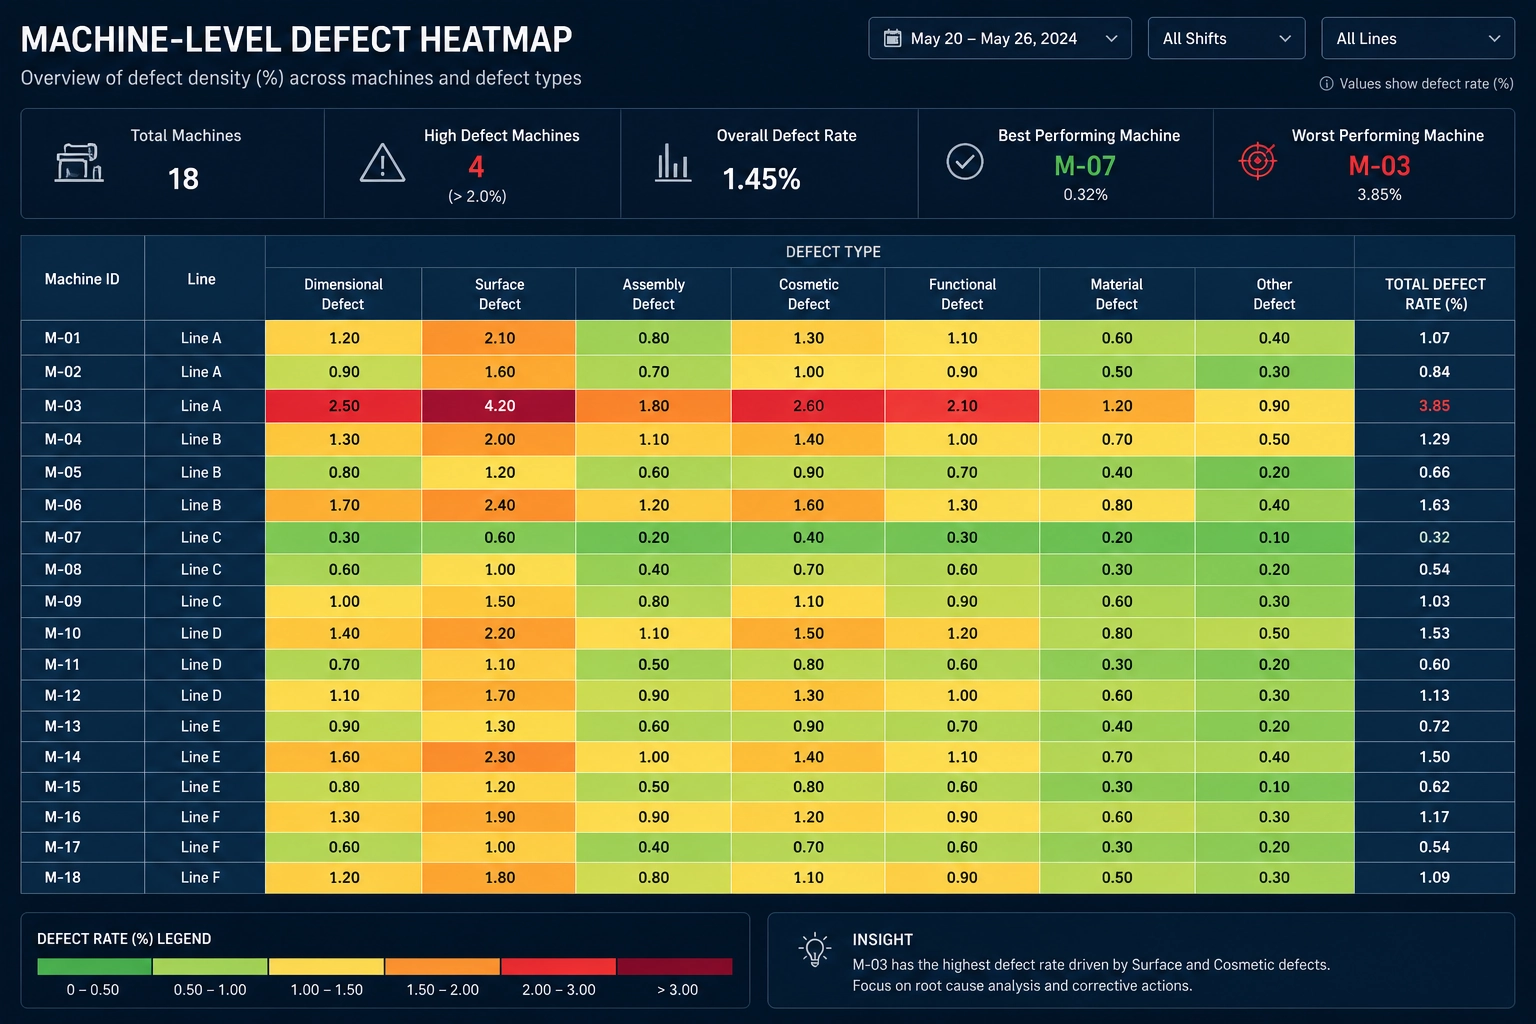
- Live defect tracking by machine, line, and shift
- Heatmaps for identifying high-risk production zones
- Trend charts for FPY, scrap, and rework
- Alerts for out-of-spec measurements
- Drill-down views for operators and engineers
- MES (Manufacturing Execution Systems)
- ERP (Enterprise Resource Planning)
- SCADA and PLC sensors
- Quality management systems
- Maintenance logs
- Inventory and supply chain systems
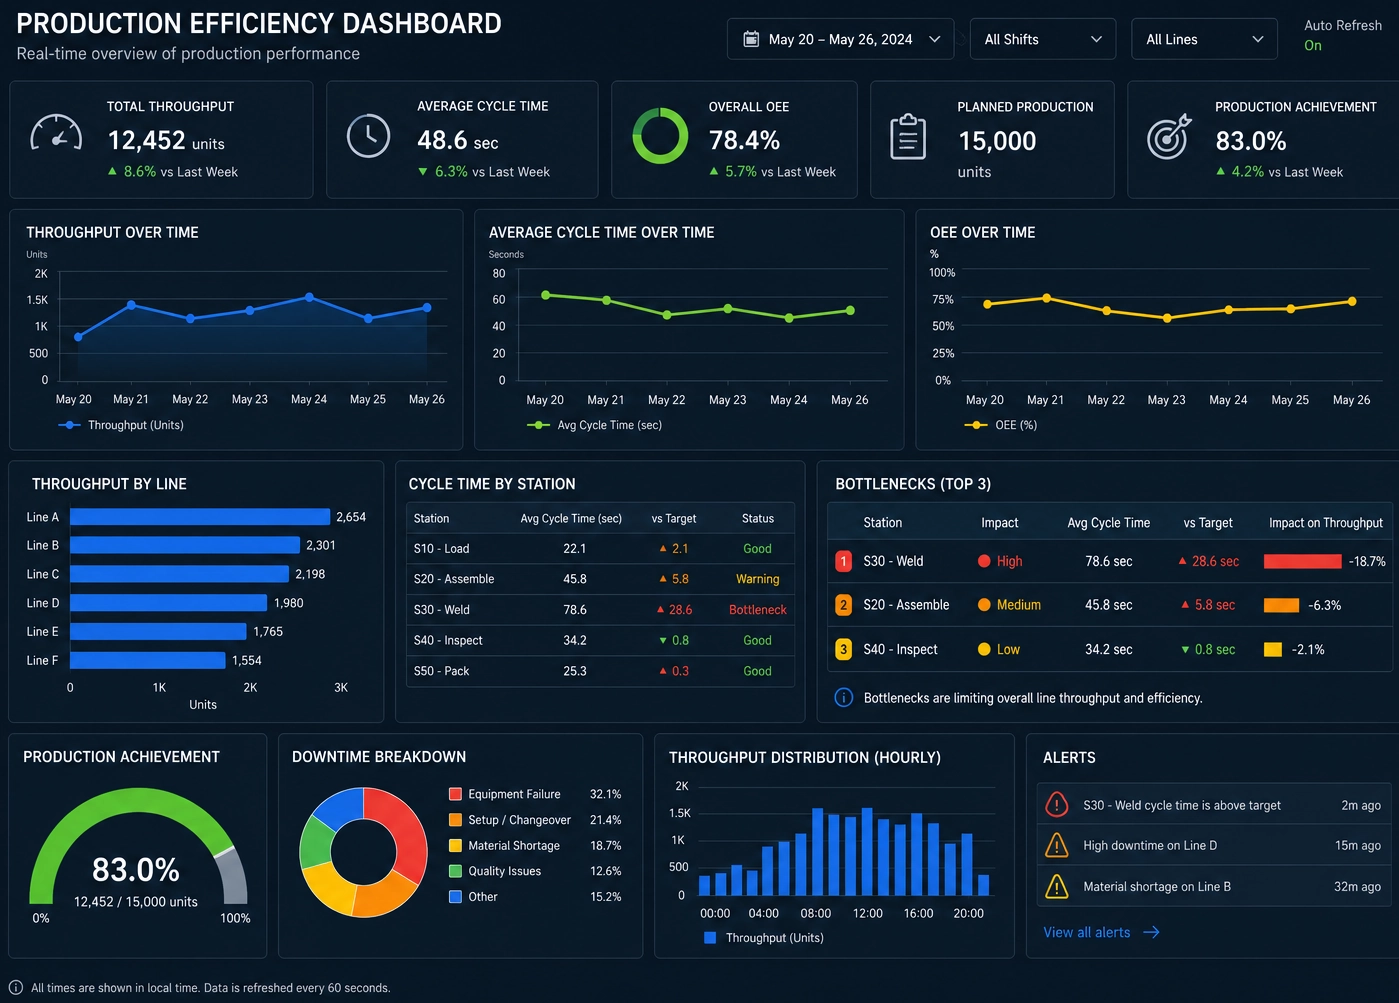
A Production Efficiency dashboard highlights how well each manufacturing line is performing by visualizing throughput, cycle time, and bottleneck locations. It typically includes real‑time metrics showing machine utilization, shift‑level output, and comparisons against planned production targets. The dashboard helps teams quickly spot slowdowns, optimize scheduling, and maintain consistent flow across the factory floor.
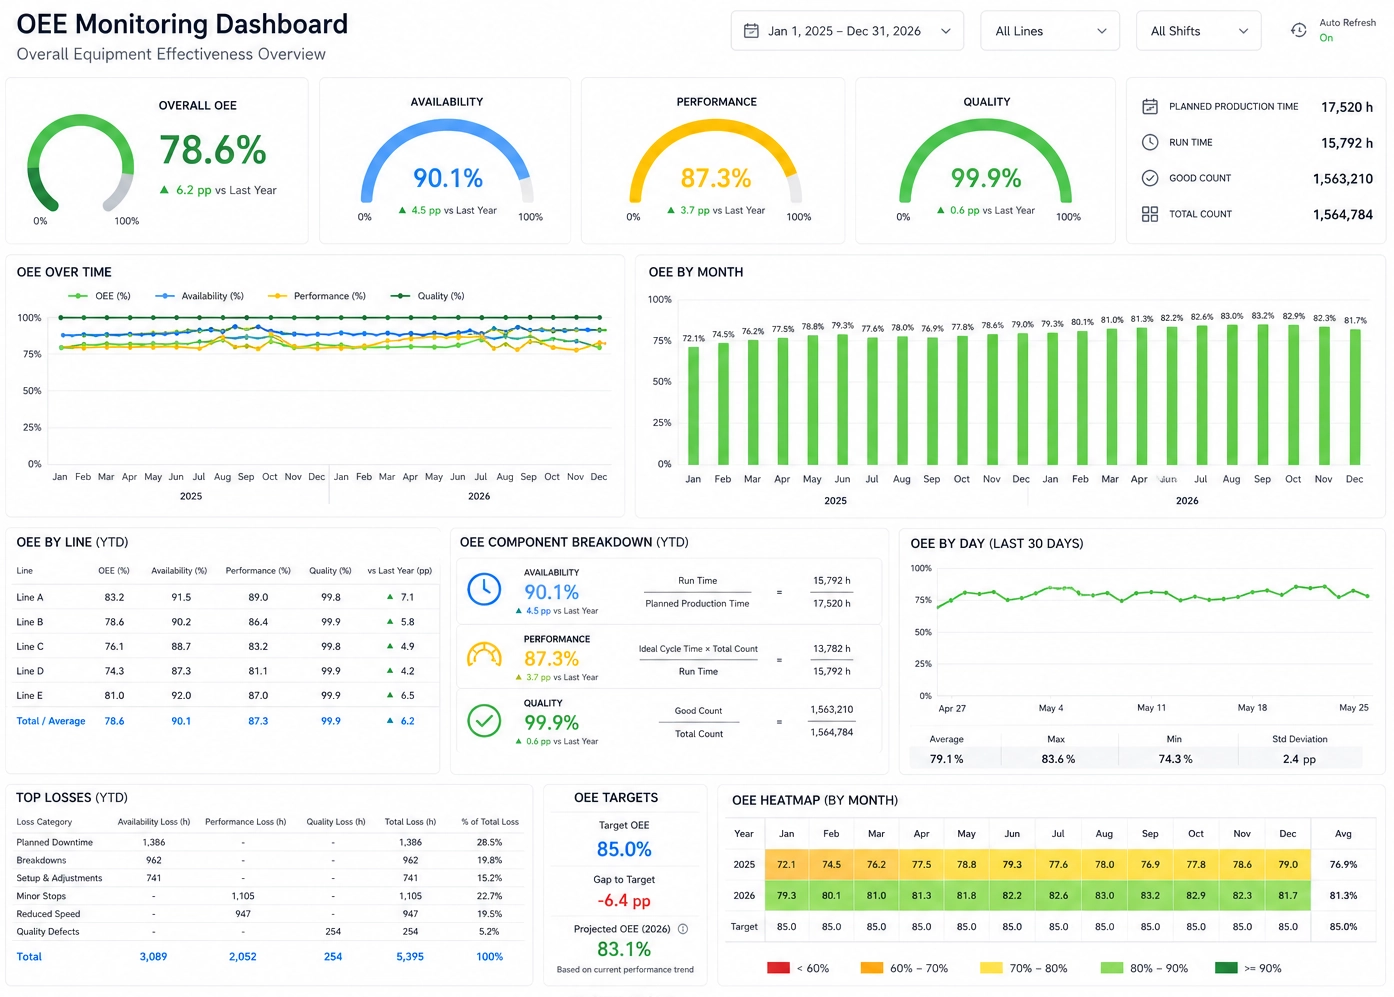
An OEE Monitoring dashboard gives operations teams a real‑time view of how effectively their equipment is running by breaking performance into the three core components of OEE: Availability, Performance, and Quality. It typically displays machine‑level uptime, speed losses, and defect counts so teams can immediately spot where production efficiency is slipping. The dashboard helps identify chronic bottlenecks, unplanned downtime patterns, and quality‑related slowdowns, enabling faster corrective action on the factory floor.
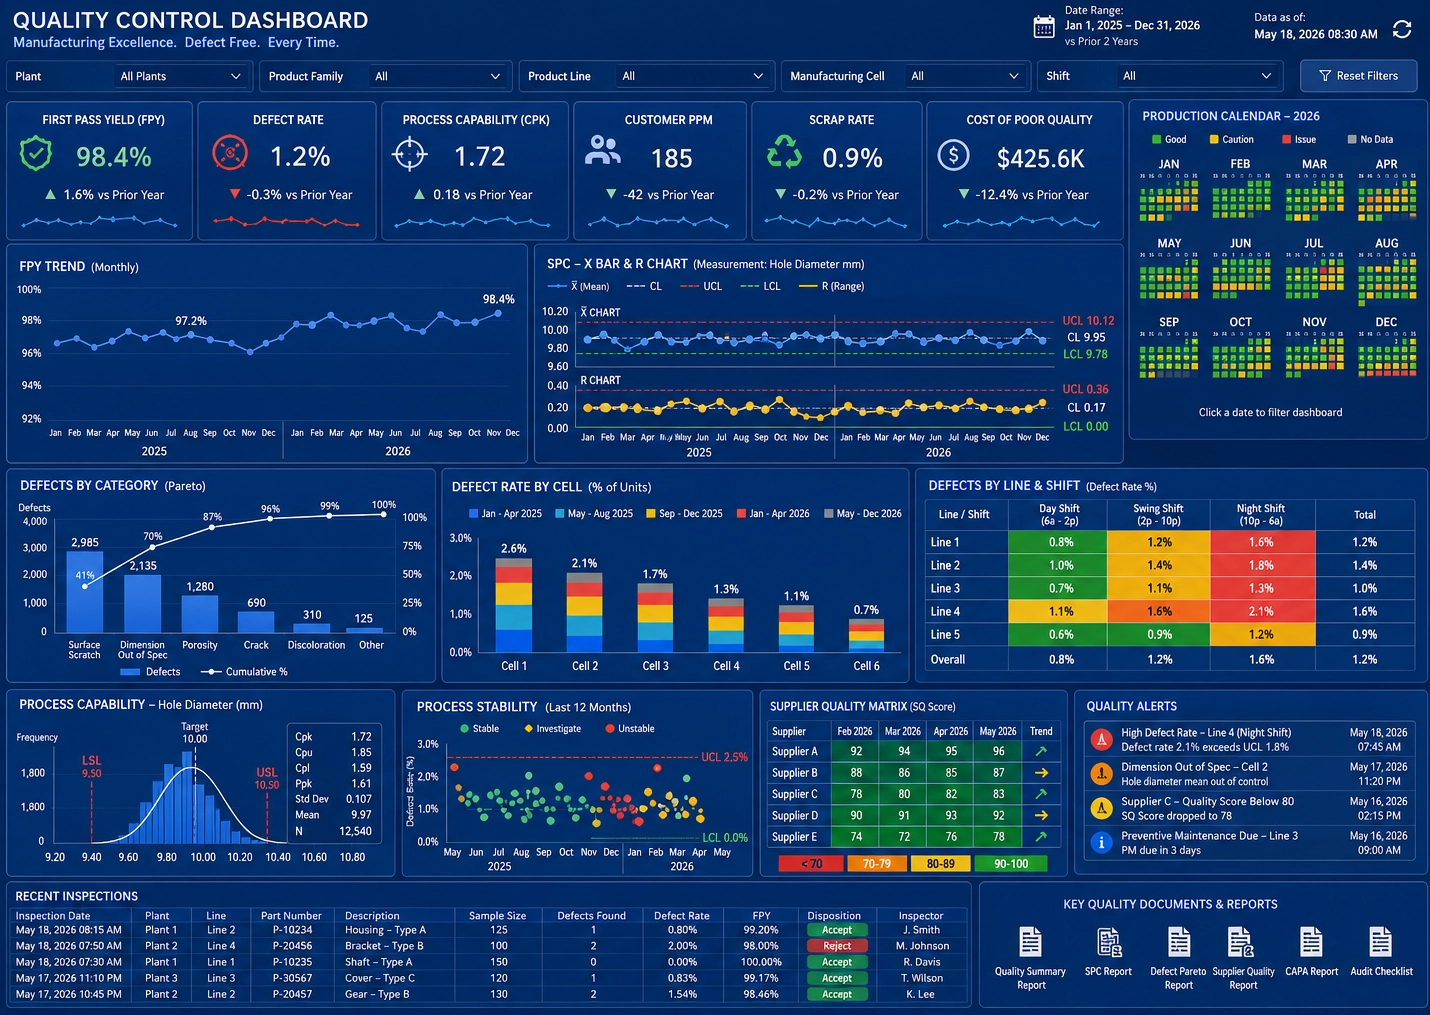
A Quality Control dashboard provides insights into the quality performance of manufacturing processes by tracking metrics such as First Pass Yield (FPY), defect rates, and Statistical Process Control (SPC) charts. It helps teams identify quality issues early, reduce rework, and maintain consistent product standards.
This example illustrates how a modern manufacturing dashboard surfaces quality issues in real time.
Core Features
Data Sources Integrated
Manufacturing dashboards unify data from:
This multi-source mashup enables a complete view of production health.
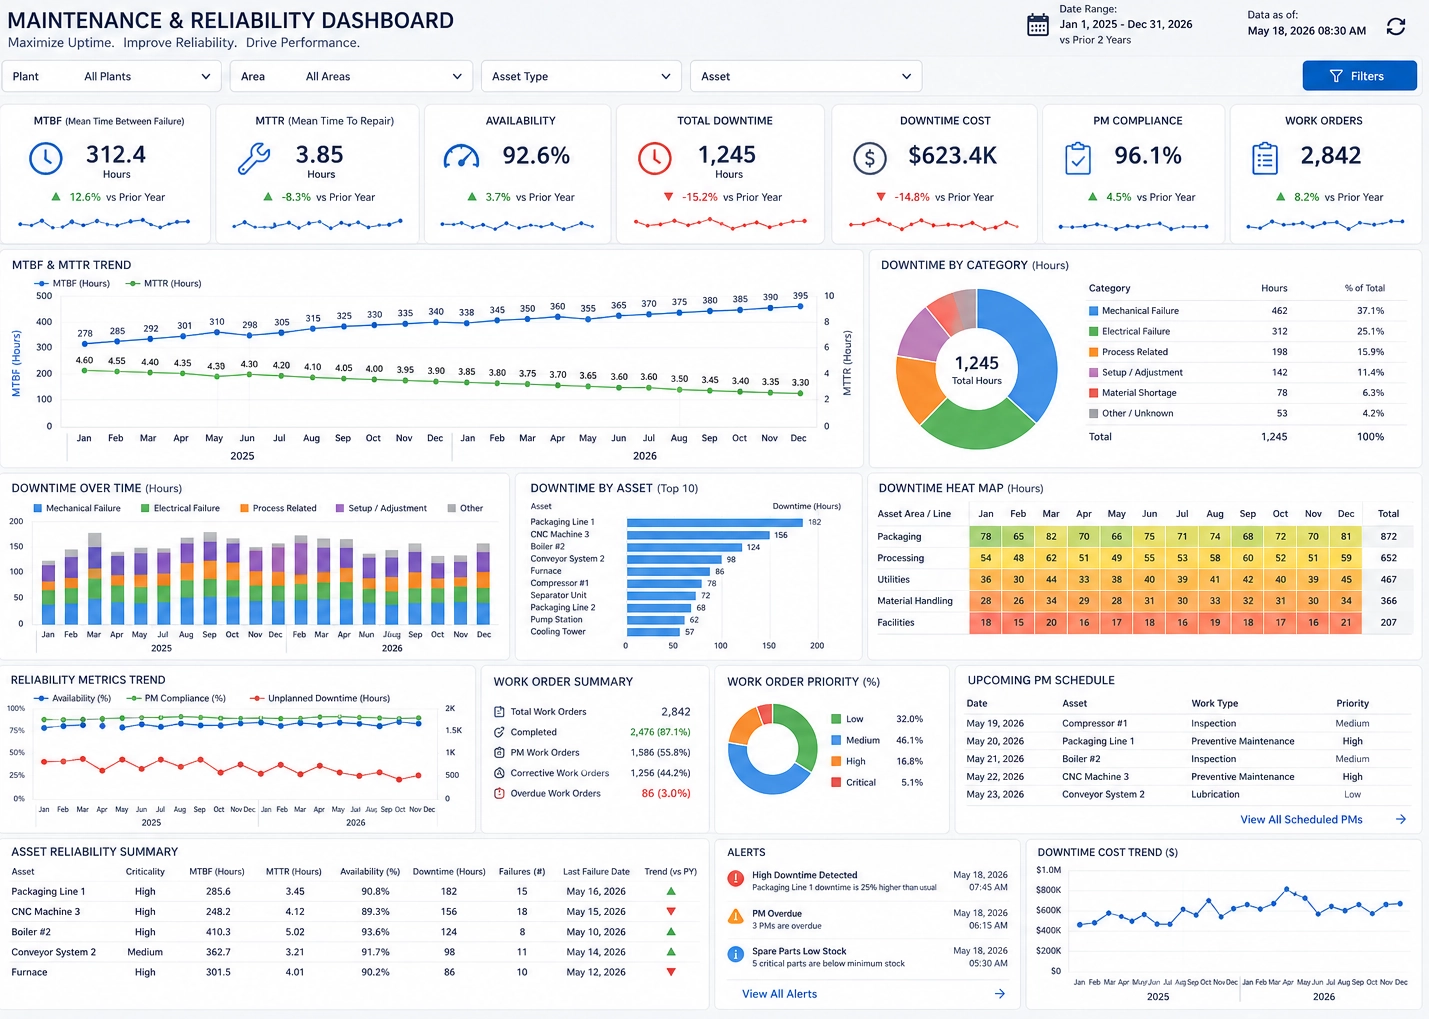
A Maintenance and Reliability dashboard helps teams monitor equipment health and maintenance activities by tracking metrics such as Mean Time Between Failures (MTBF), Mean Time to Repair (MTTR), and overall downtime. It enables proactive maintenance planning, reduces unplanned downtime, and improves asset reliability.
Dashboards vs. Spreadsheets vs. BI Tools

Best Practices for Manufacturing Dashboards
- Real-time monitoring for immediate issue detection
- Data mashup across MES, ERP, SCADA
- Interactive filtering for role-based insights
- KPI standardization across lines and plants
- Mobile-friendly layouts for operators on the floor
- Color-coded alerts for quality deviations

Why StyleBI for Manufacturing Dashboards
StyleBI provides a flexible, enterprise-grade platform for building interactive dashboards tailored to manufacturing operations.
Benefits
- Real-time data mashup across MES, ERP, SCADA, and quality systems
- Interactive filtering for operators, engineers, and managers
- Self-service dashboard authoring without coding
- Automated alerts for quality deviations
- Enterprise reporting and scheduled distribution
- Secure, scalable architecture for global factories
What systems integrate with StyleBI?
StyleBI integrates with MES, ERP, SCADA, quality systems, maintenance logs, and more.
AI in Manufacturing Dashboards
Artificial intelligence has become one of the most transformative layers in modern manufacturing dashboards, turning traditional KPI monitoring into predictive, adaptive, and autonomous decision systems. Instead of simply visualizing what has already happened, AI‑enhanced dashboards interpret patterns, forecast outcomes, and recommend actions that improve quality, throughput, and equipment reliability.
How AI Enhances Manufacturing Dashboards
- Predictive quality — AI models detect subtle patterns in defect data, SPC signals, and sensor readings to forecast quality drift.
- Anomaly detection — machine‑learning algorithms automatically flag unusual machine behavior, cycle‑time spikes, or yield drops.
- Predictive maintenance — AI analyzes vibration, temperature, load, and historical failure data to predict MTBF and recommend maintenance windows.
- Automated root‑cause analysis — dashboards enriched with AI correlate defects with machines, materials, operators, or environmental conditions.
- Intelligent alerts — AI adjusts alert sensitivity based on context, reducing false positives and improving response time.
- Production optimization — AI models simulate production scenarios to recommend optimal scheduling, line balancing, or batch sequencing.
AI‑Driven KPI Evolution
AI enhances traditional KPIs by making them predictive and adaptive:
- OEE becomes predictive OEE, forecasting availability and performance issues.
- Cycle time becomes dynamic cycle time, adjusting expectations based on machine health and material flow.
- Defect rate becomes predicted defect probability, enabling proactive quality interventions.
Why AI Matters for Manufacturing
AI shifts dashboards from reactive to proactive:
- Problems are prevented instead of detected.
- Maintenance is scheduled before breakdowns.
- Quality issues are corrected before scrap accumulates.
- Production plans adapt automatically to real‑time conditions.
AI + StyleBI
When integrated into a platform like StyleBI, AI models can be embedded directly into dashboard tiles, enabling:
- Real‑time inference
- Model‑driven alerts
- Predictive KPI widgets
- Automated recommendations for operators and engineers
This transforms dashboards from passive displays into active decision‑making systems.

FAQ
What is a manufacturing dashboard?
A manufacturing dashboard is a real-time visual system that tracks production, quality, and maintenance KPIs.
Which KPIs matter most?
OEE, defect rate, cycle time, downtime, yield, and MTBF are among the most important KPIs.
How do dashboards improve quality?
They surface defects early, highlight trends, and accelerate root-cause analysis, reducing scrap and rework.