Meeting Analytics Dashboard
Meetings are essential for collaboration, but excessive meetings can reduce productivity, fragment employee schedules, and increase labor costs.
A meeting analytics dashboard helps organizations measure how employees spend their time, identify unnecessary meetings, protect focus time, and optimize workplace collaboration.
The dashboard example shown here provides a comprehensive analysis of organizational meeting behavior, including meeting hours, focus time availability, meeting costs, recurring meeting effectiveness, room utilization, after-hours collaboration, and calendar management trends.

What Is a Meeting Analytics Dashboard?
A meeting analytics dashboard is a business intelligence application that collects calendar, attendance, conference room, and collaboration data to evaluate how meetings impact employee productivity and company performance.
The dashboard helps leaders understand whether meetings create value, consume excessive resources, or interfere with focused work. By analyzing participation patterns and meeting outcomes, organizations can improve collaboration while reducing unnecessary calendar activity.
Executive Meeting Performance Summary
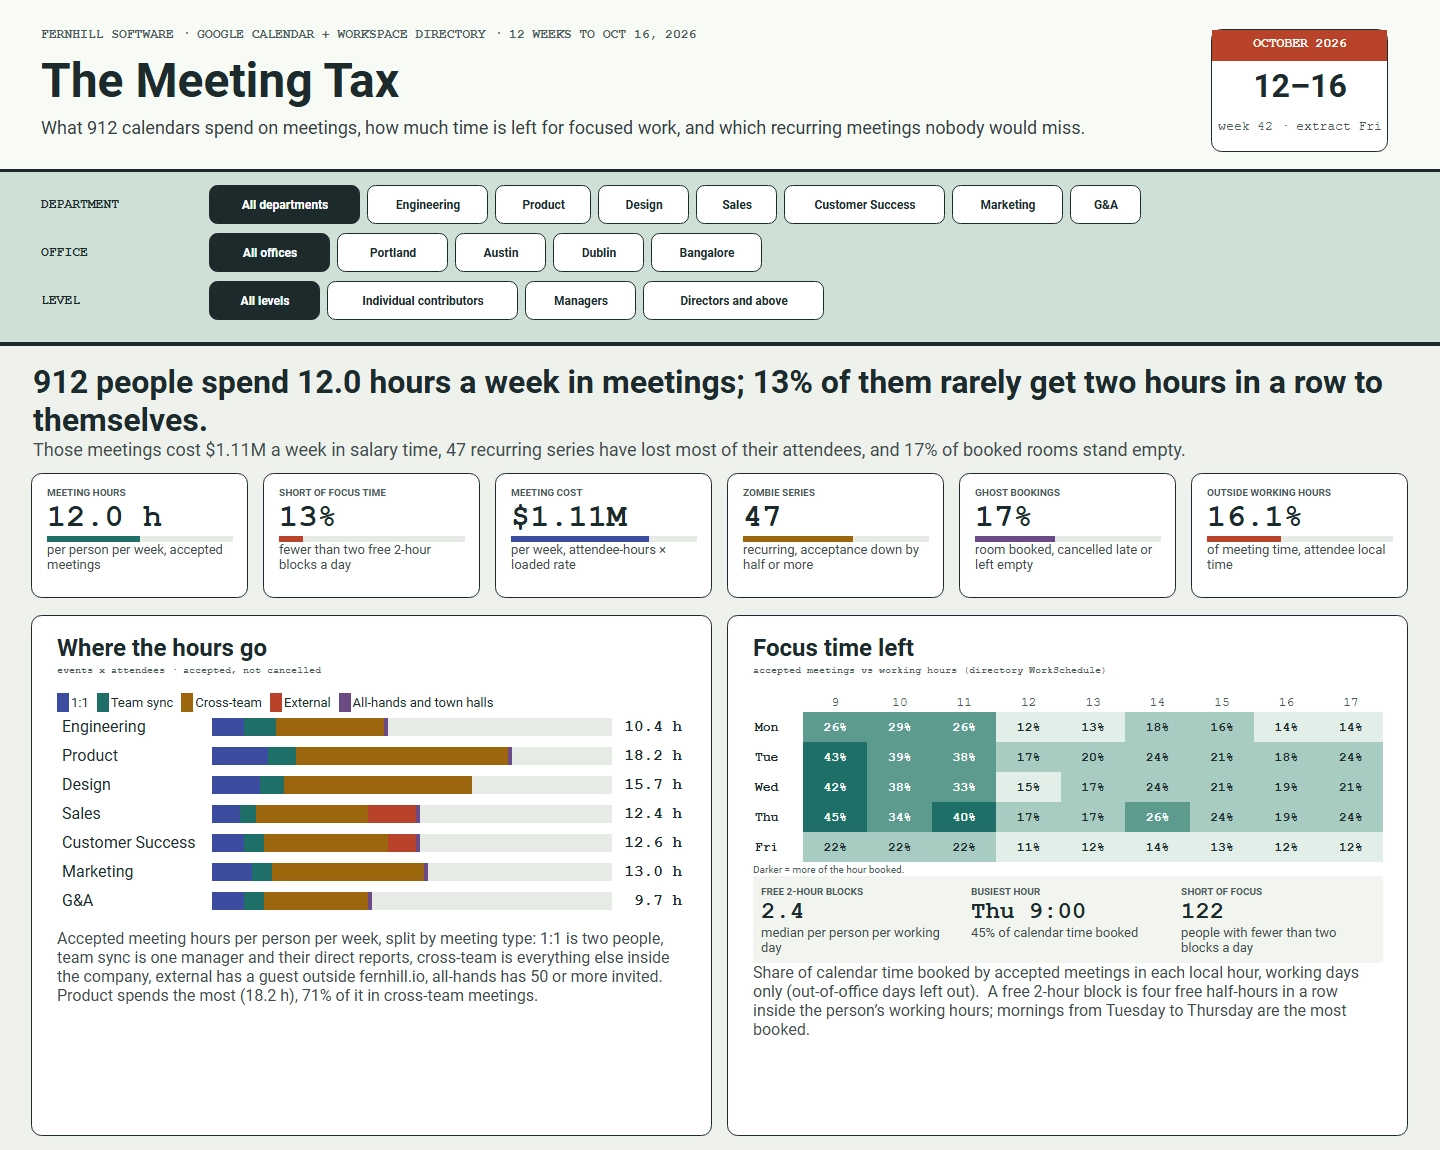
At the top of the dashboard, key metrics deliver an immediate overview of workplace collaboration and meeting effectiveness.
- Average meeting hours per employee
- Percentage of employees lacking focus time
- Total meeting cost
- Ineffective recurring meetings
- Unused conference room bookings
- Meetings outside working hours
These metrics help executives understand whether meetings support productivity or are creating organizational friction.
Where Meeting Time Goes
The dashboard breaks down meeting time by category, helping managers understand how employees spend their calendars.
Common meeting categories include:
- Team synchronization meetings
- Cross-functional collaboration meetings
- External customer or partner meetings
- Department meetings
- Company-wide all-hands meetings
Analyzing time allocation reveals whether employees spend most of their week on productive collaboration or on meetings that create limited business value.
Focus Time Analysis
One of the most important workforce productivity metrics is uninterrupted focus time. The dashboard measures how much time employees have available for deep work and identifies workers whose schedules are heavily fragmented.
Organizations can monitor:
- Consecutive free hours
- Daily focus blocks
- Calendar occupancy rates
- Peak meeting periods
- Focus time by department
By protecting focus time, organizations can improve employee satisfaction, creativity, and productivity.
Recurring Meeting Effectiveness
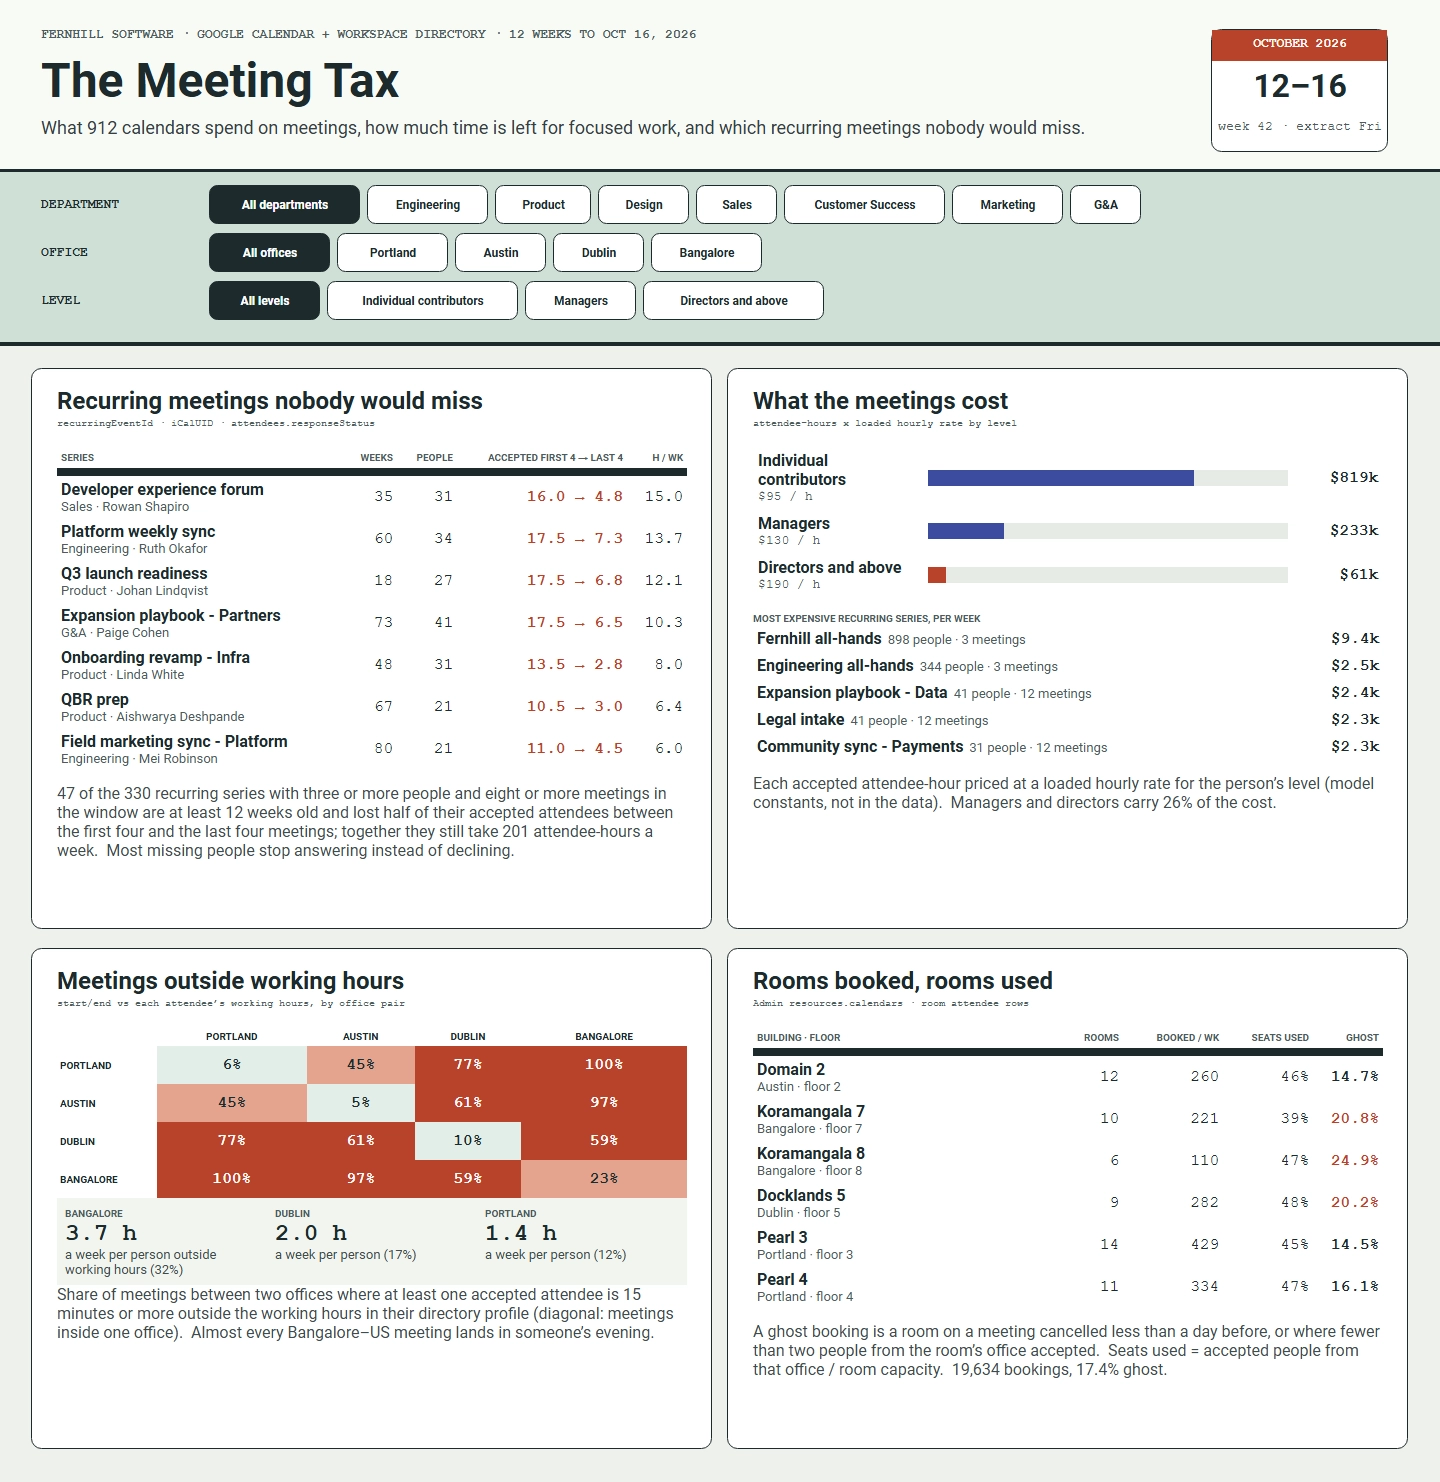
Many recurring meetings continue long after their original purpose has disappeared. This section identifies recurring meetings experiencing declining attendance, participation, or engagement.
Metrics may include:
- Attendance trends
- Acceptance rates
- Meeting duration
- Participant counts
- Meeting cost per session
Managers can use these insights to eliminate unnecessary meetings and reclaim valuable employee time.

Meeting Cost Analysis
Every meeting has a labor cost based on participant attendance and compensation levels. The meeting cost section estimates the financial impact of meetings across the organization.
Organizations can evaluate:
- Total meeting expenses
- Meeting costs by department
- Meeting costs by employee level
- Most expensive recurring meetings
- Cost trends over time
Understanding meeting costs helps leaders balance collaboration needs with operational efficiency goals.
Meetings Outside Working Hours
Global organizations frequently schedule meetings across multiple time zones. This section highlights meetings occurring outside normal working hours and measures their impact on employee schedules.
Common indicators include:
- Evening meetings
- Early morning meetings
- Cross-region collaboration conflicts
- Time zone imbalances
- After-hours attendance frequency
These insights support healthier work-life balance practices and fair meeting scheduling.

Conference Room Utilization
Meeting analytics often extends beyond calendars to physical workplace resources. The dashboard measures conference room usage and identifies underutilized or wasted room reservations.
Room-management metrics may include:
- Room occupancy rates
- Booking volumes
- Unused reservations
- Cancellation frequency
- Ghost bookings
- Room capacity utilization
Facilities teams can use this information to optimize workplace space planning and improve room availability.
Meeting Changes and Cancellations
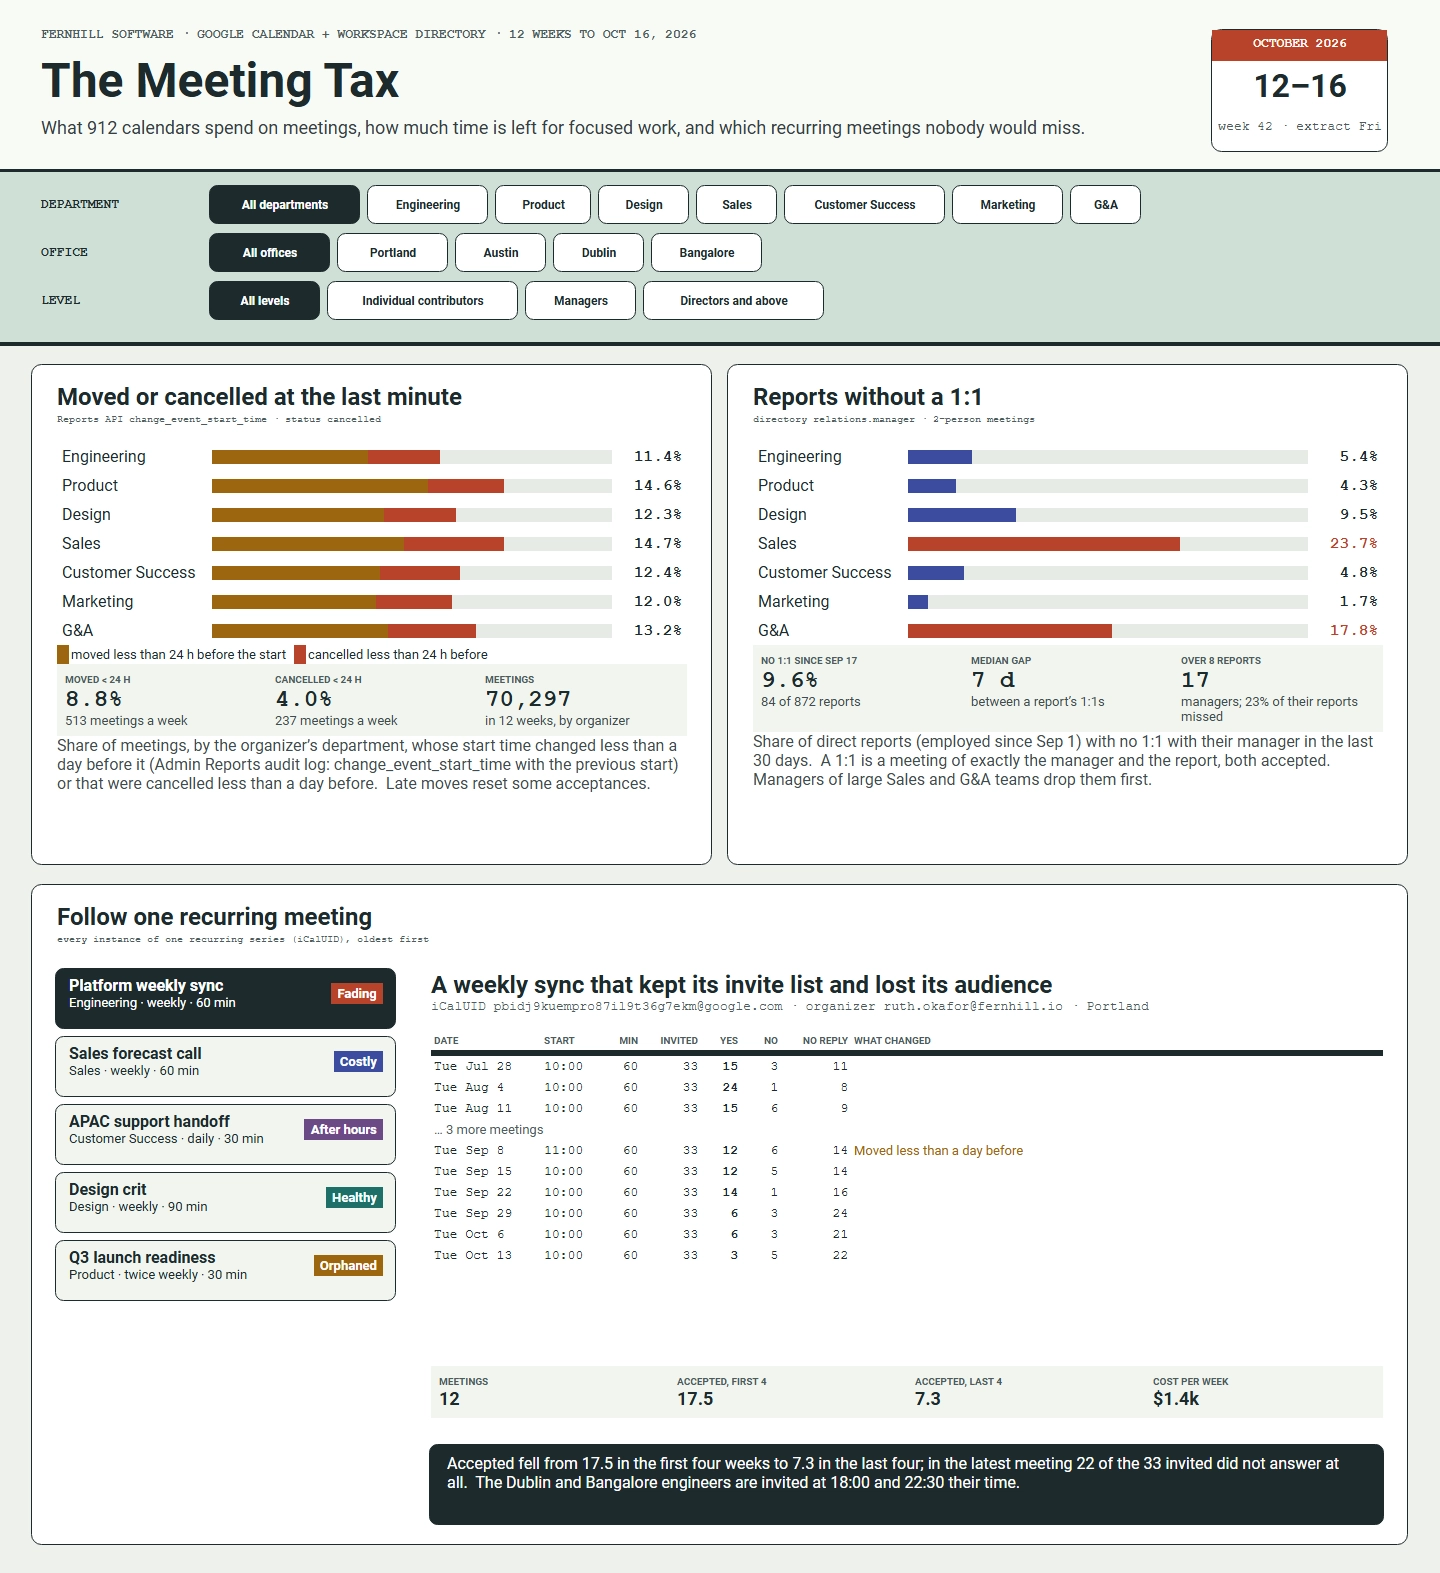
Frequent meeting rescheduling can disrupt employee planning and reduce productivity. The dashboard tracks meetings that are moved or canceled shortly before their scheduled start times.
Monitoring these trends helps organizations identify departments or teams where calendar management practices require improvement.
Management and Employee Engagement Metrics
Many organizations use meeting analytics to evaluate management effectiveness and employee engagement. One common metric measures how often managers conduct one-on-one meetings with direct reports.
The dashboard can reveal:
- Employees without recent one-on-ones
- Manager engagement rates
- Department communication patterns
- Leadership accessibility
- Coaching and development opportunities
These insights help strengthen manager-employee relationships and support employee development programs.
Recurring Meeting Drill-Down Analysis
A detailed meeting investigation view enables users to examine a specific recurring meeting over time. Attendance changes, participation trends, acceptance rates, meeting duration, and meeting costs can all be evaluated from a single screen.
This level of detail allows organizations to determine whether a recurring meeting is healthy, declining, costly, or no longer needed.

Key Meeting Analytics KPIs
- Average weekly meeting hours
- Focus time availability
- Meeting cost per employee
- Meeting cost per department
- Attendance rates
- Recurring meeting effectiveness
- After-hours meeting percentage
- Conference room utilization
- Meeting cancellation rate
- Meeting reschedule rate
- One-on-one meeting coverage
- Calendar occupancy rate
Benefits of a Meeting Analytics Dashboard
A meeting analytics dashboard helps organizations improve workforce productivity by providing visibility into how employee time is spent. Leaders can identify excessive meeting loads, reduce low-value meetings, promote focus time, improve conference room utilization, and lower collaboration costs.
By transforming calendar and workplace collaboration data into actionable insights, meeting analytics dashboards enable companies to create healthier schedules, more effective meetings, and a more productive work environment.