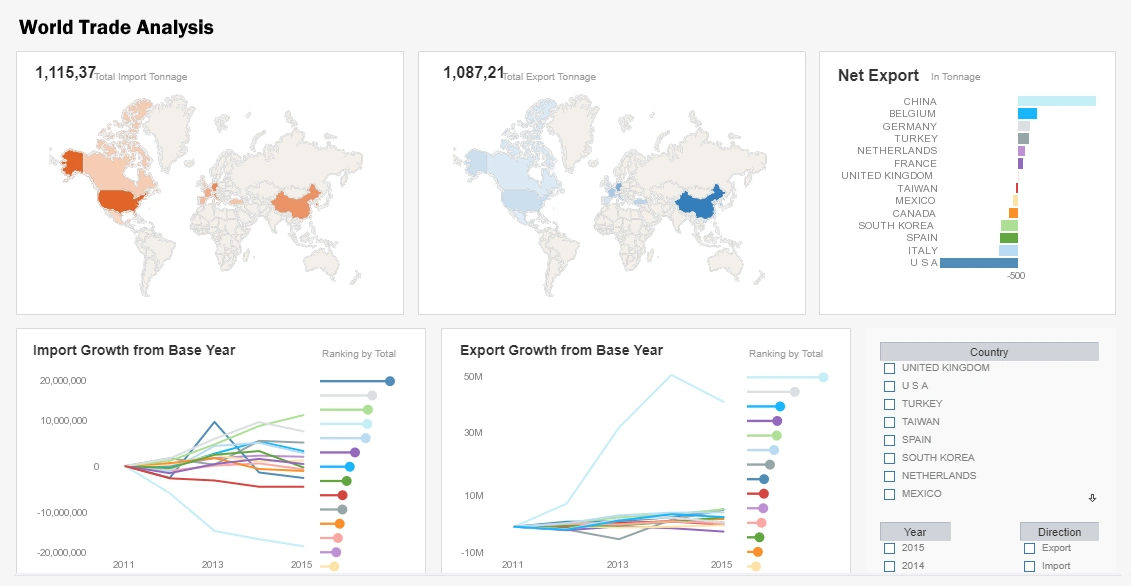
Mobile BI Dashboard Example from InetSoft
Mobile Business Intelligence (MBI)
- Puts Key Performance Indicators (KPI) right at your fingertips
- Delivers real-time data mashup, interactive dashboards, and customizable visualizations
- Previously only Flash enabled mobile devices could leverage InetSoft's mobile BI tools
- Now, non-Flash enabled browsers are served via HTML5 - an Internet markup language that supports rich interactivity
Mobile Business Intelligence: Hit the Ground Running
The buzz behind mobile business intelligence is the result of new technologies rising up to serve an old enterprise need – faster, richer, and more reliable information. Organizations that frequently monitor key performance indicators and quickly respond to changes in the market have always outperformed their slower, less informed counterparts.


Mobile business intelligence is more than just text messages and alerts to your phone. The true value behind mobile business intelligence is the ability to view sophisticated visualizations, interact with data in real time, and empower business users to make sound decisions. Thanks to new mobile technologies, like smartphones and tablet computers, businesses can finally take full advantage of mobile BI.
Major market research firms predict that one-third of all business intelligence access will be through mobile devices within the next few years, suggesting that it’s not a matter of if, but when. Companies that adopt mobile BI platforms early have the added benefit of moving their users up the experience curve as mobile technology improves further. Considering the major advantages of BI, it’s important for companies not to be caught flat-footed with mobile BI.
Examples of Mobile BI in Action
Sales Teams equipped with Mobile BI have access to sales figures, quotas and purchasing trends, and they are better prepared for negotiations.
Sales Teams On-the-Go can stay informed in real time. Mobile BI offers them access to important data while they are on the road and the ability to quickly evaluate a sales situation and collaborate with their team beforehand.
Suppliers, for example in an autoparts company, can leverage Mobile BI so their managers can quickly determine the reason why a major client's order was delayed. Mobile BI will tell managers when the client's order was placed, where the holdup is and what can be done to get things back on track.
Top Management and C-level executives can use customizable visualizations and interactive dashboards to check on KPIs instantly. Mobile BI gives top management access to critical information out of the office so they can make timely and well informed decisions for their stakeholders.
More Mobile Bi Dashboard Examples
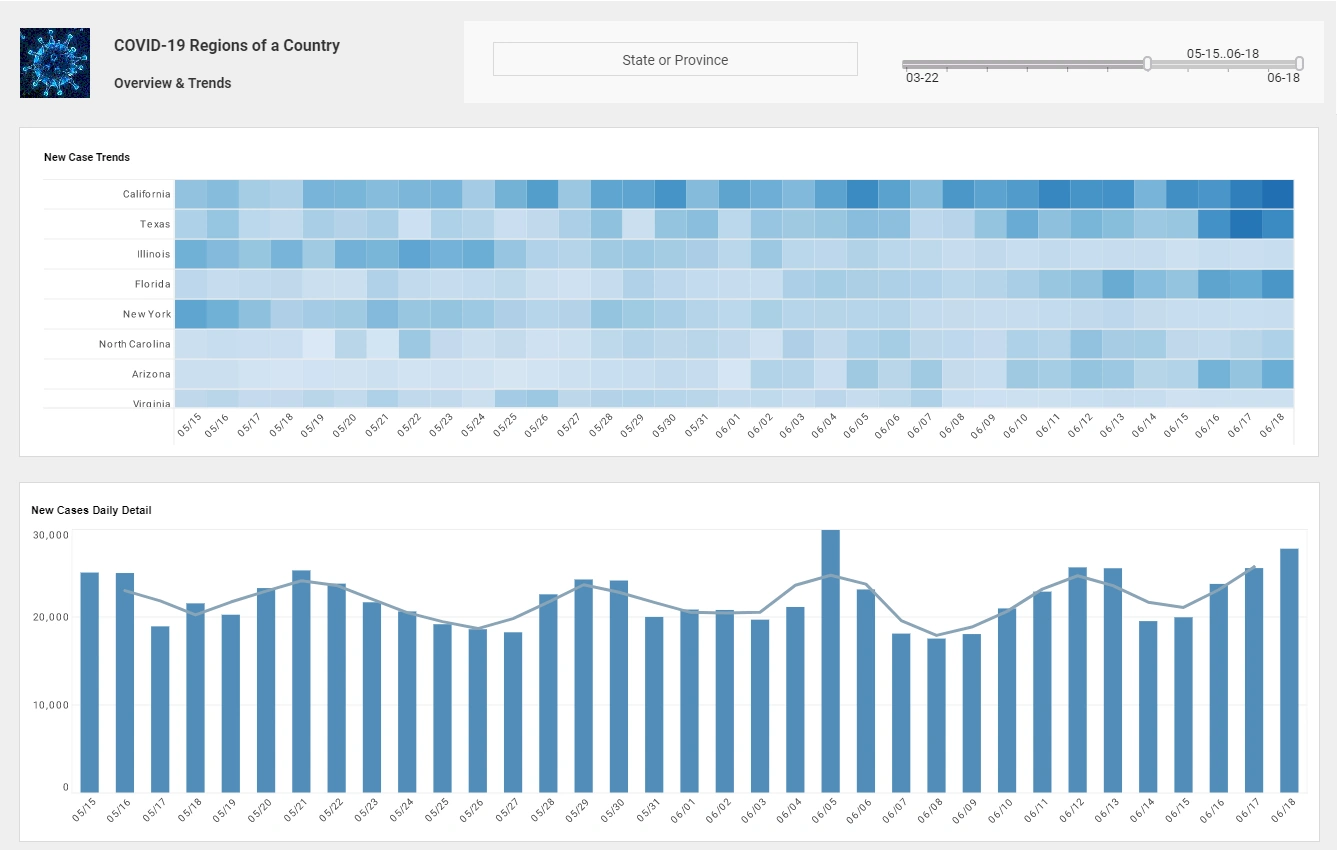
Below are some business visualization examples to give you a look at some of the advanced displays that can be created using Style Intelligence. Style Intelligence can be used to build visualizations for any type of department or industry. These visualizations can be built by nontechnical users with a basic Excel level understanding of data.
Mobile Product Returns Dashboard
Mobile Marketing Leads Dashboard

This mobile product return analysis dashboard highlights how a dashboard can incorporate many different pastel shades and not be overwhelming. This allows color to be used as an additional dimension on both dashboard charts. Tapping any of the colored data points with a finger reveals which categories are signified by which colors.

This mobile marketing leads dashboard dashboard provides an overall picture of new leads, their sources, and their conversion rates, with a large map chart displaying new leads performance by state. A slider below one of the line charts modifies the change rate that results in a chart highlight.
Mobile Construction Dashboard
Mobile Product Sales Visualization

This dashboard helps property developers track construction accidents, in the hope of improving worker safety. Various checkbox filters can be easily selected with a finger on the touch screen, adding multiple options for drilldown to help answer safety and efficiency questions.

This mobile sales dashboard gives a high level overview to executives monitoring inventory and sales performance. Profit and price are also detailed, covering basic accounting needs as well as sales. Color is used in several of the charts to add another dimension. Chart types used throughout include a waterfall chart displaying profit by product line, and a donut chart displaying product categories.
Mobile Work Orders Dashboard
Mobile Project Management Dashboard

This mobile work orders dashboard displays the percentage of work orders started and completed, and tracks the man hours necessary for completion of said work orders. A number of line charts display the fluctuations in these various measures over time, enabling on the go managers to pinpoint where specific issues occurred.

This mobile project management marketing dashboard example aids in the monitoring of various marketing initiatives and the start and end times of various project stages. This type of dashboard helps digital marketing agencies track the progress of their consultants on various initiatives. A Gantt chart tracks the start and end date of various projects, giving a visual representation of project durations. Gantt charts come as a standard option in InetSoft's visualization engine.
Mobile Production Dashboard

This mobile production dashboard is designed to provide an overview of production times, costs, and errors, displayed with a variety of charts and text kpis. The Produce Time by Product chart compares production times for each product to set benchmarks, helping managers to assess performance at-a-glance. A tappable calendar display enables out of office production managers to investigate specific production delays or pinpoint product issues.
Mobile Call Center Dashboard

This mobile tech support dashboard makes it easier for regional call center managers to manage their customer service teams at their various branches. A red highlight shows when teams fall below goals on call period, call time, call status, and wait time. A mobile accessible selection tree enables the dashboard to be drilled down into specific teams and members.
Want to try building an InetSoft dashboard yourself? Sign up for our free test drive, no download required.