Payment Processing Dashboards
Payment processing dashboards are business intelligence tools that provide real-time visibility into how money moves through an organization's payment ecosystem. They consolidate transaction, authorization, settlement, refund, and dispute data from payment gateways, processors, acquiring banks, digital wallets, e-commerce systems, and financial platforms into a single analytical environment.
For many businesses, every percentage point of payment approval rate matters. A small increase in failed transactions, chargebacks, or processing costs can significantly affect revenue and profitability. Payment processing dashboards help operations, finance, and executive teams monitor performance continuously so problems can be identified and resolved before they become expensive.
Why Payment Processing Dashboards Matter
Every payment transaction follows a complex path involving customers, payment providers, fraud screening systems, banks, and settlement platforms. Along that journey, revenue can be lost through authorization failures, fraud, refunds, disputes, network fees, and operational inefficiencies.
Payment processing dashboards provide transparency into every stage of this process, helping organizations understand where transactions succeed, where they fail, and how efficiently collected funds reach the business.
- Improve transaction approval rates.
- Reduce payment failures.
- Monitor fraud prevention effectiveness.
- Track refunds and chargebacks.
- Analyze payment method performance.
- Control processing expenses.
- Optimize settlement operations.
- Increase overall revenue capture.
Payment Funnel Analysis
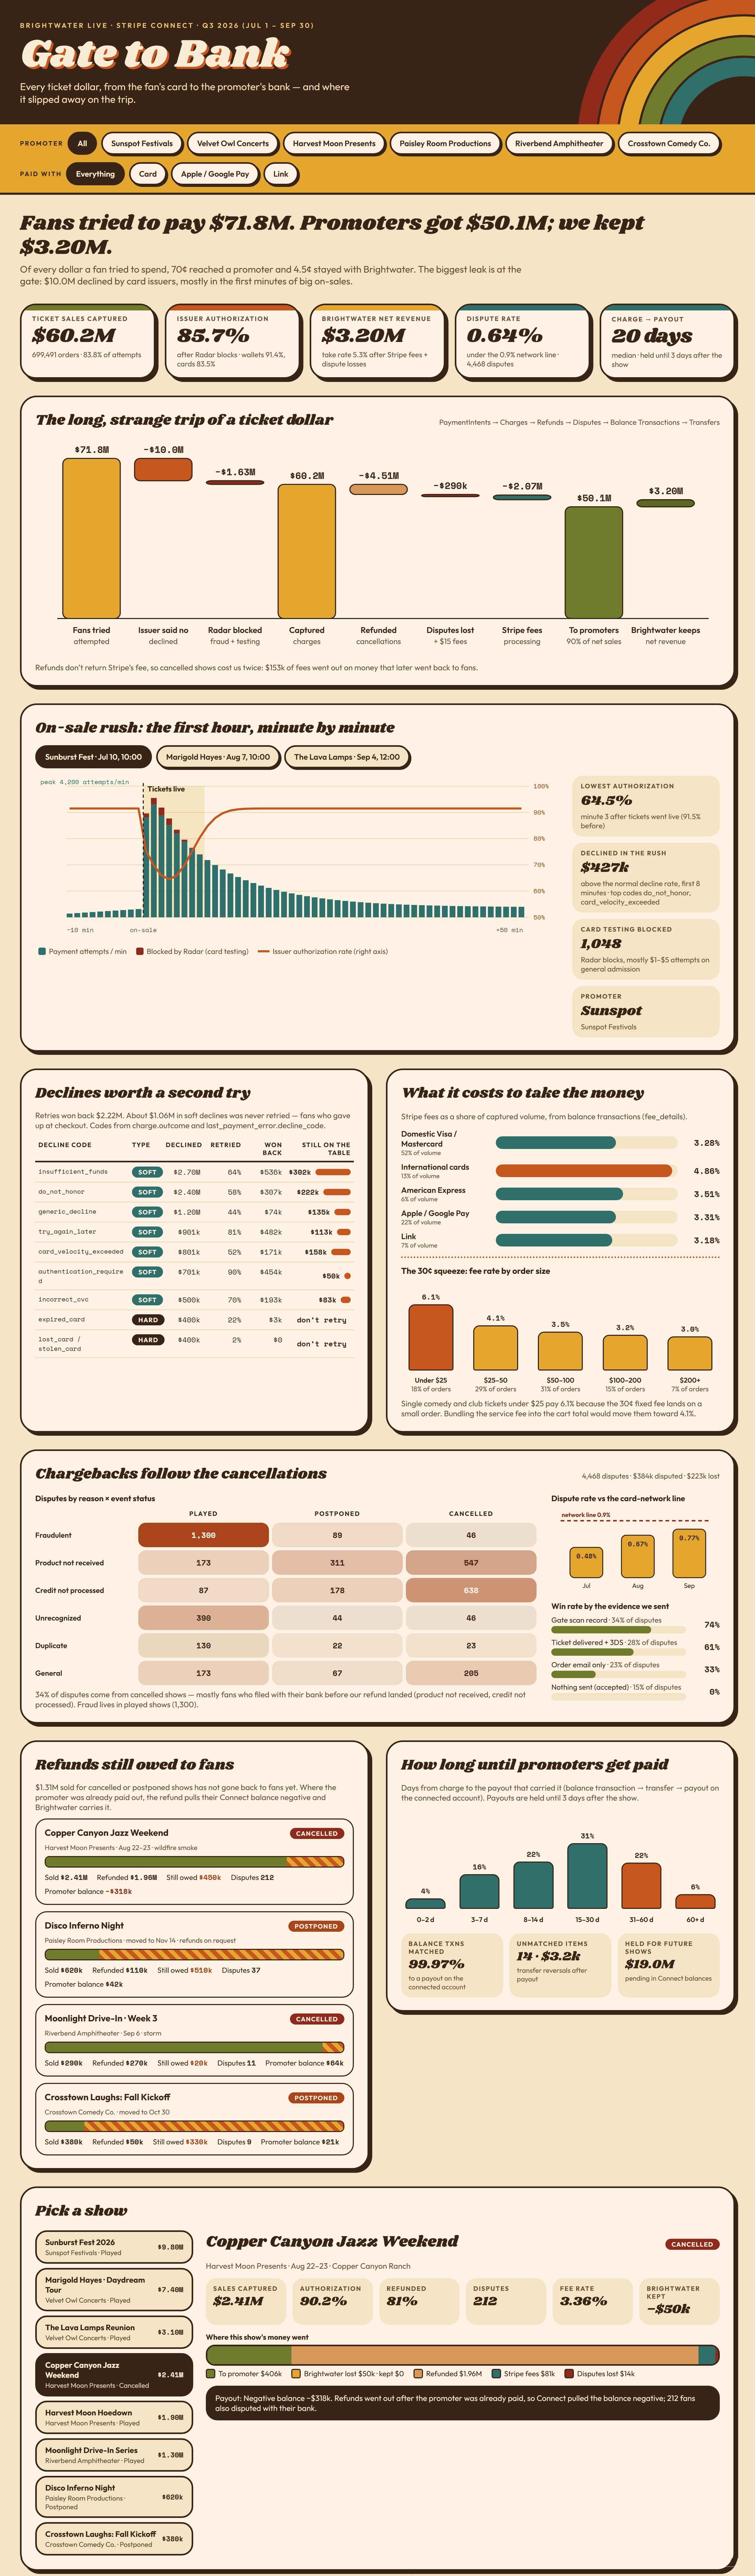
One of the most important functions of a payment processing dashboard is visualizing the complete payment funnel. Organizations need to understand what happens between a customer's purchase attempt and the final settlement of funds.
A payment funnel typically measures attempted transactions, authorization approvals, captured payments, refunds, disputes, processing fees, and net revenue. By analyzing each stage of the funnel, managers can quickly identify where revenue leakage occurs and determine the root causes of transaction losses.
Modern dashboards frequently use waterfall charts and flow diagrams to illustrate how payment volume moves through the processing lifecycle and how much revenue remains after deductions.

Payment Method Analytics
Customers increasingly use multiple payment options including credit cards, debit cards, digital wallets, bank transfers, buy-now-pay-later services, and payment links. Each payment type may produce different approval rates, processing costs, customer behaviors, and dispute patterns.
Payment processing dashboards allow decision makers to compare payment methods side by side using metrics such as:
- Transaction volume
- Revenue generated
- Authorization rate
- Average transaction value
- Processing fees
- Refund percentage
- Chargeback frequency
- Settlement timing
These comparisons help organizations determine which payment methods maximize revenue while minimizing operational costs.
Fraud and Risk Management Dashboards
Fraud prevention systems play a critical role in modern payment operations. Payment dashboards help organizations balance fraud prevention with customer experience by measuring fraud detection accuracy and reviewing blocked transactions.
Risk management teams use dashboards to analyze suspicious activity, card-testing attacks, unusual purchase patterns, geographic anomalies, velocity violations, and fraud screening effectiveness.
By monitoring both fraud losses and false-positive declines, organizations can optimize fraud controls without unnecessarily increasing customer friction.
Refund and Chargeback Monitoring
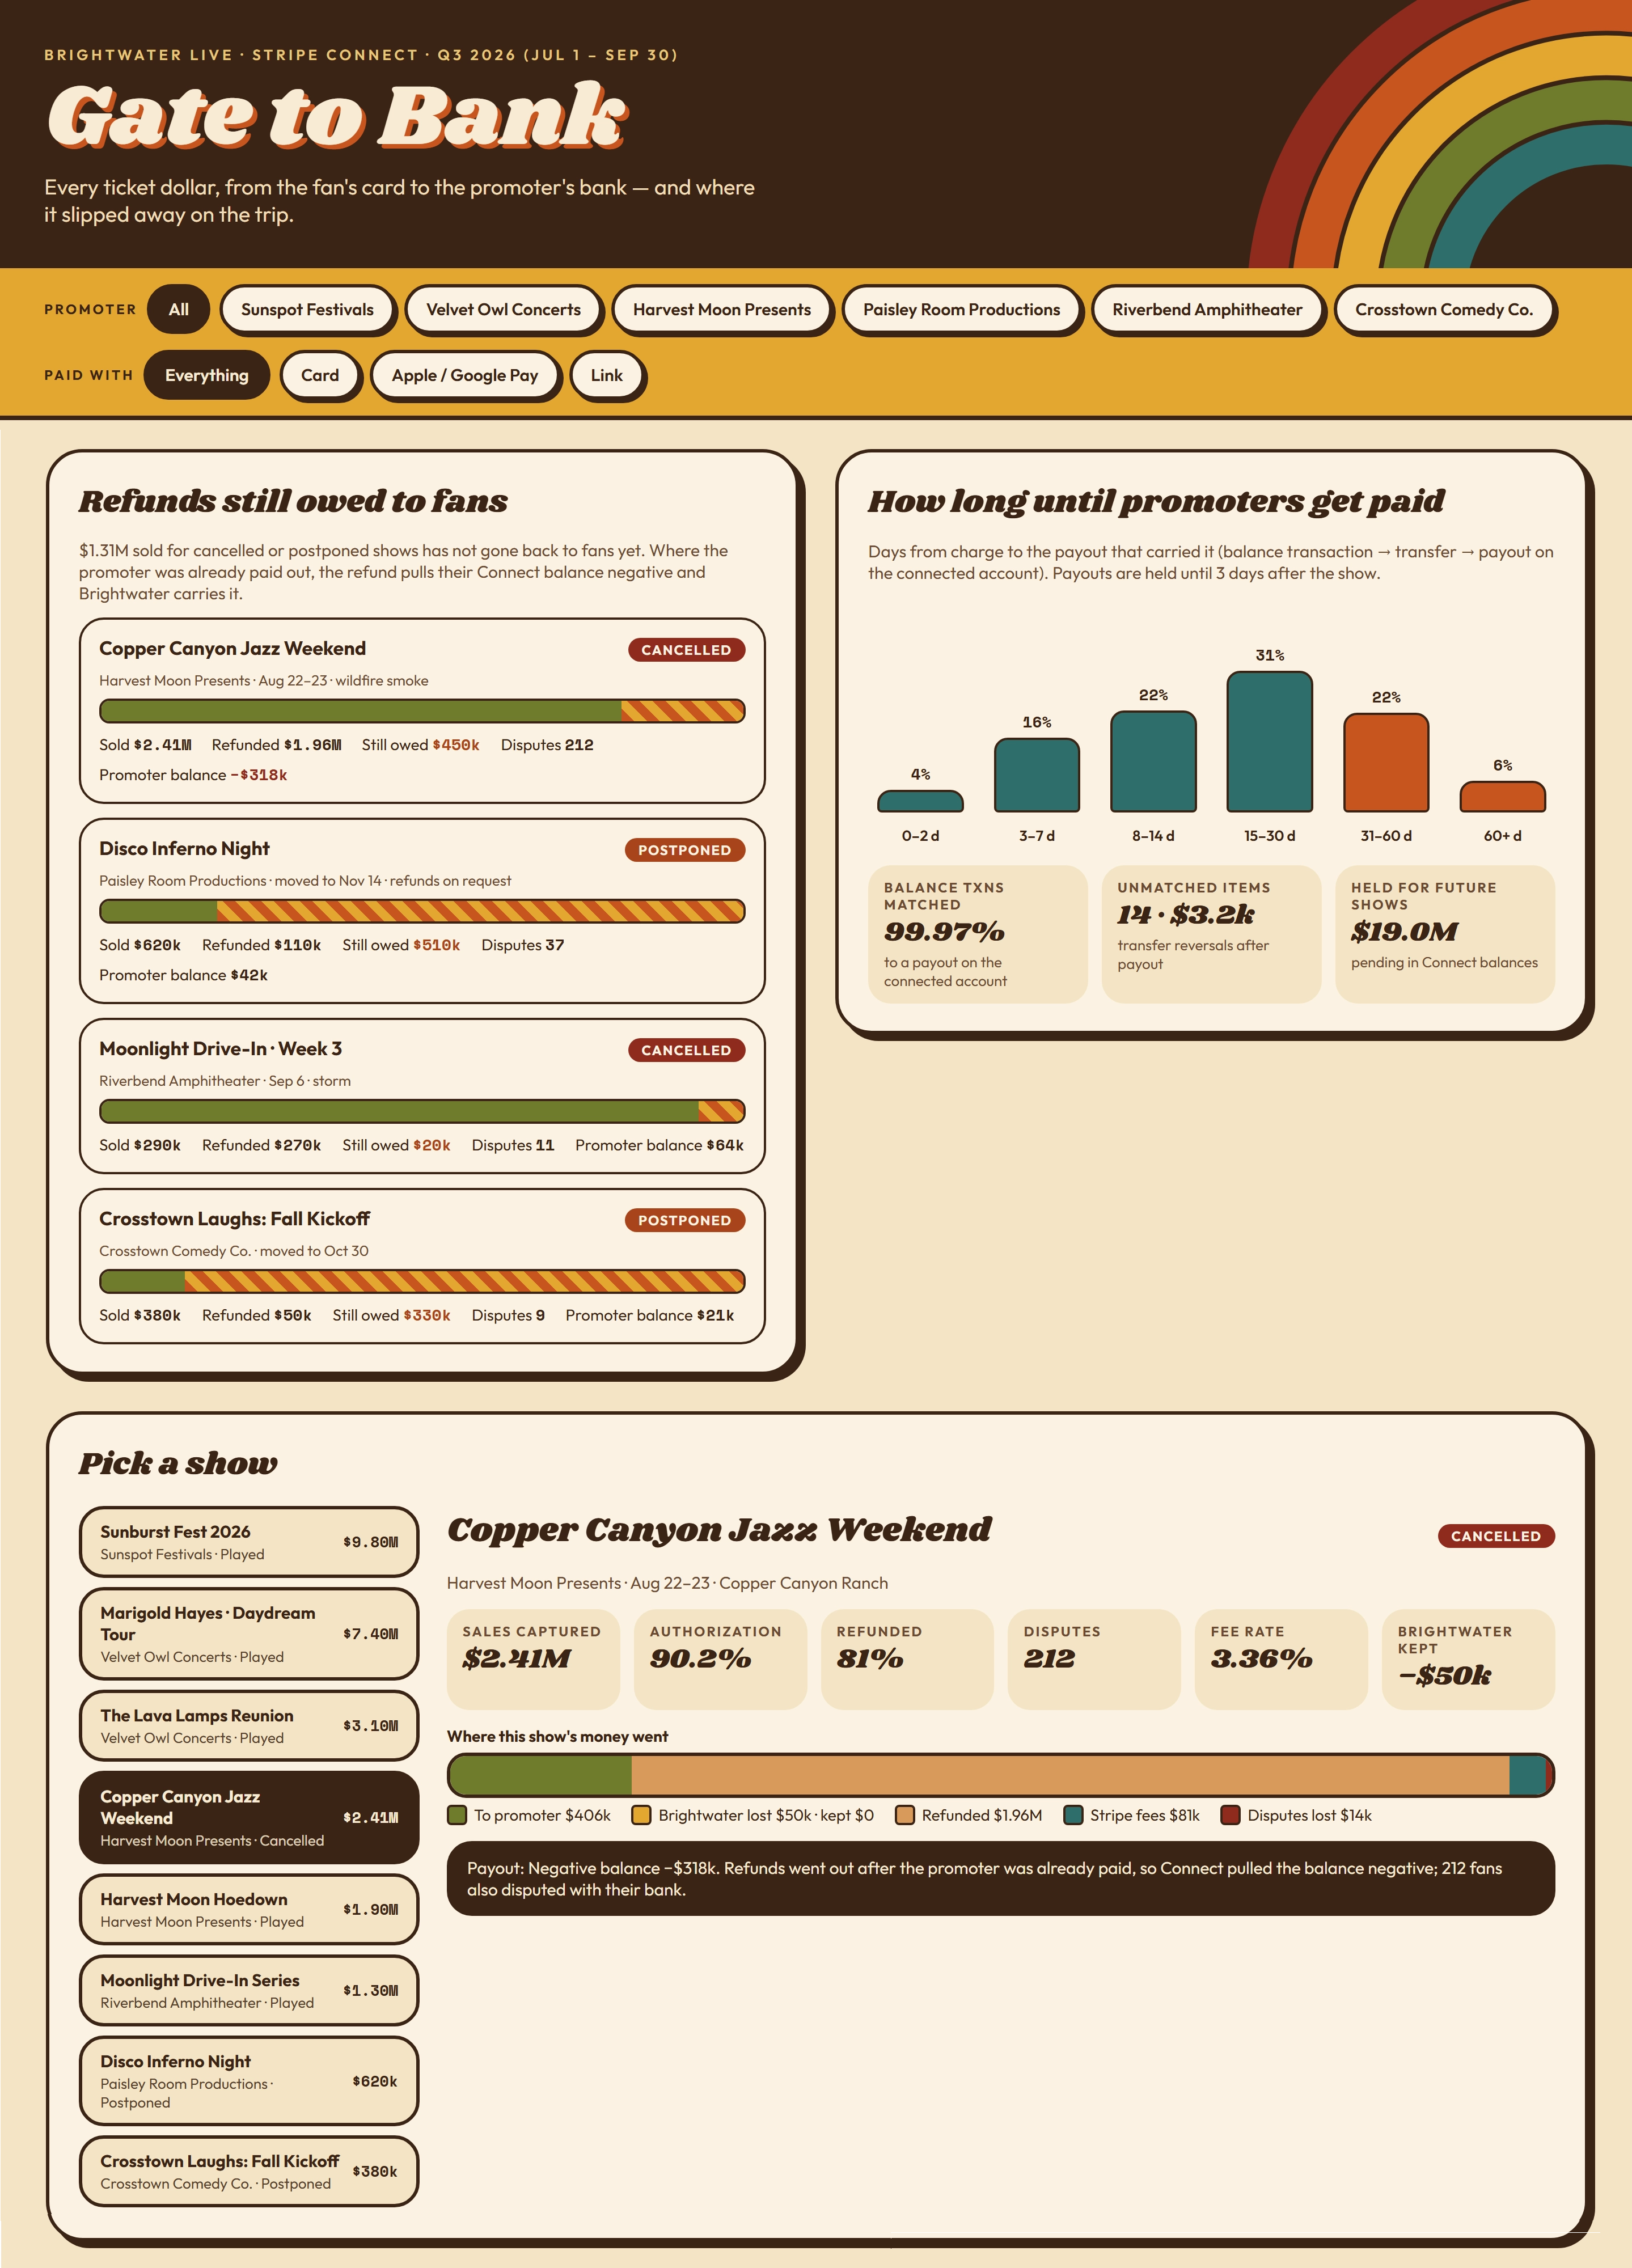
Refunds and chargebacks represent two significant sources of payment-related costs. Dashboards help organizations track both operational trends and financial impact.
Refund analytics provide visibility into refund volume, refund rates, refund processing times, and refund liabilities. Chargeback analytics measure dispute rates, dispute reasons, evidence effectiveness, recovery rates, and financial losses.
Organizations use these dashboards to identify recurring issues with products, services, customer communication, or fulfillment processes that contribute to increased dispute activity.
Processing Fee Analysis
Payment acceptance costs can vary significantly across payment methods, regions, customer types, and transaction sizes. Payment processing dashboards help finance teams understand the total cost of accepting payments and identify opportunities to improve margins.
Fee analysis commonly includes:
- Processing fees by payment provider.
- Fees by payment method.
- Fees by transaction size.
- Interchange costs.
- Network assessments.
- Cross-border transaction fees.
- Refund-related fee impact.
- Net processing cost percentages.
Understanding these costs enables organizations to negotiate provider relationships and optimize payment routing decisions.
Settlement and Payout Analytics
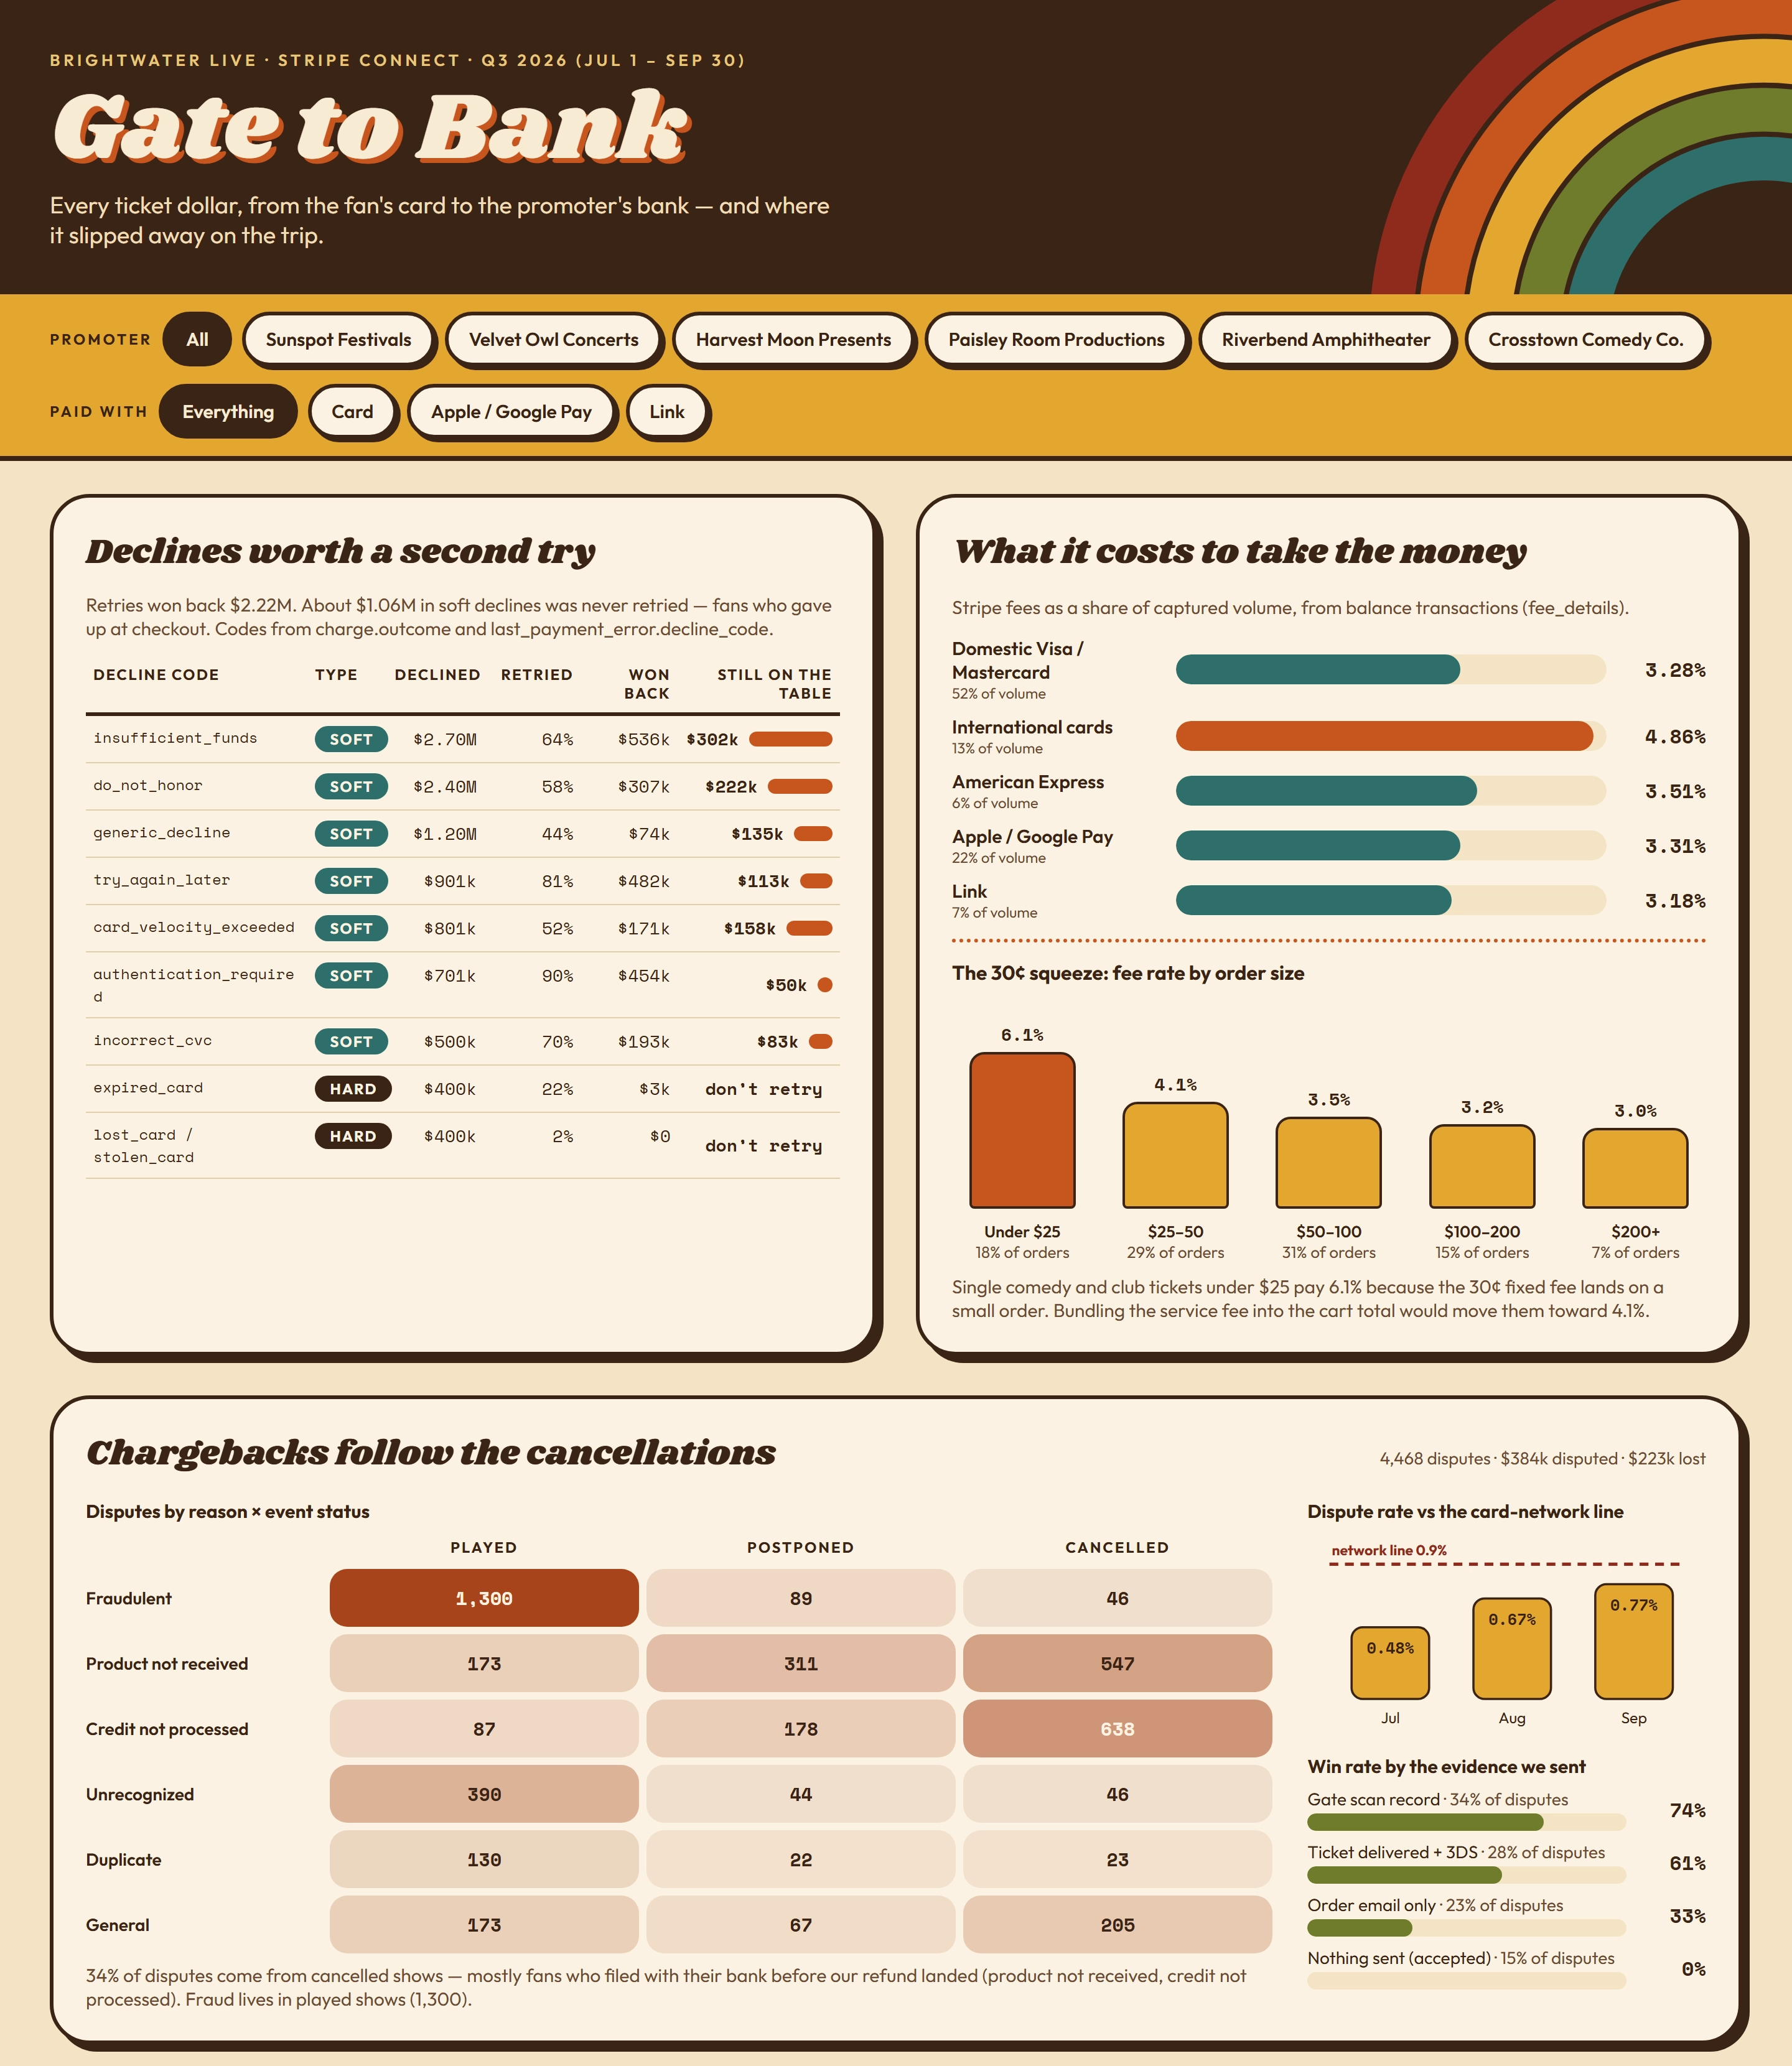
Collecting payments is only part of the payment lifecycle. Businesses must also monitor how quickly funds move through settlement systems and become available in business accounts.
Settlement dashboards measure payout timelines, settlement success rates, reconciliation accuracy, unmatched transactions, pending balances, and transfer delays. Finance departments use these dashboards to improve cash flow visibility and identify operational bottlenecks affecting revenue availability.
Key Payment Processing Dashboard KPIs
- Total Transaction Volume
- Total Revenue Processed
- Transaction Count
- Authorization Rate
- Approval Rate
- Decline Rate
- Fraud Detection Rate
- False Positive Rate
- Average Transaction Value
- Refund Rate
- Refund Amount
- Chargeback Rate
- Dispute Win Rate
- Processing Cost Percentage
- Net Revenue Captured
- Settlement Time
- Payout Completion Rate
- Payment Method Mix
- Customer Lifetime Revenue
- Revenue Leakage Percentage
Industries That Use Payment Processing Dashboards
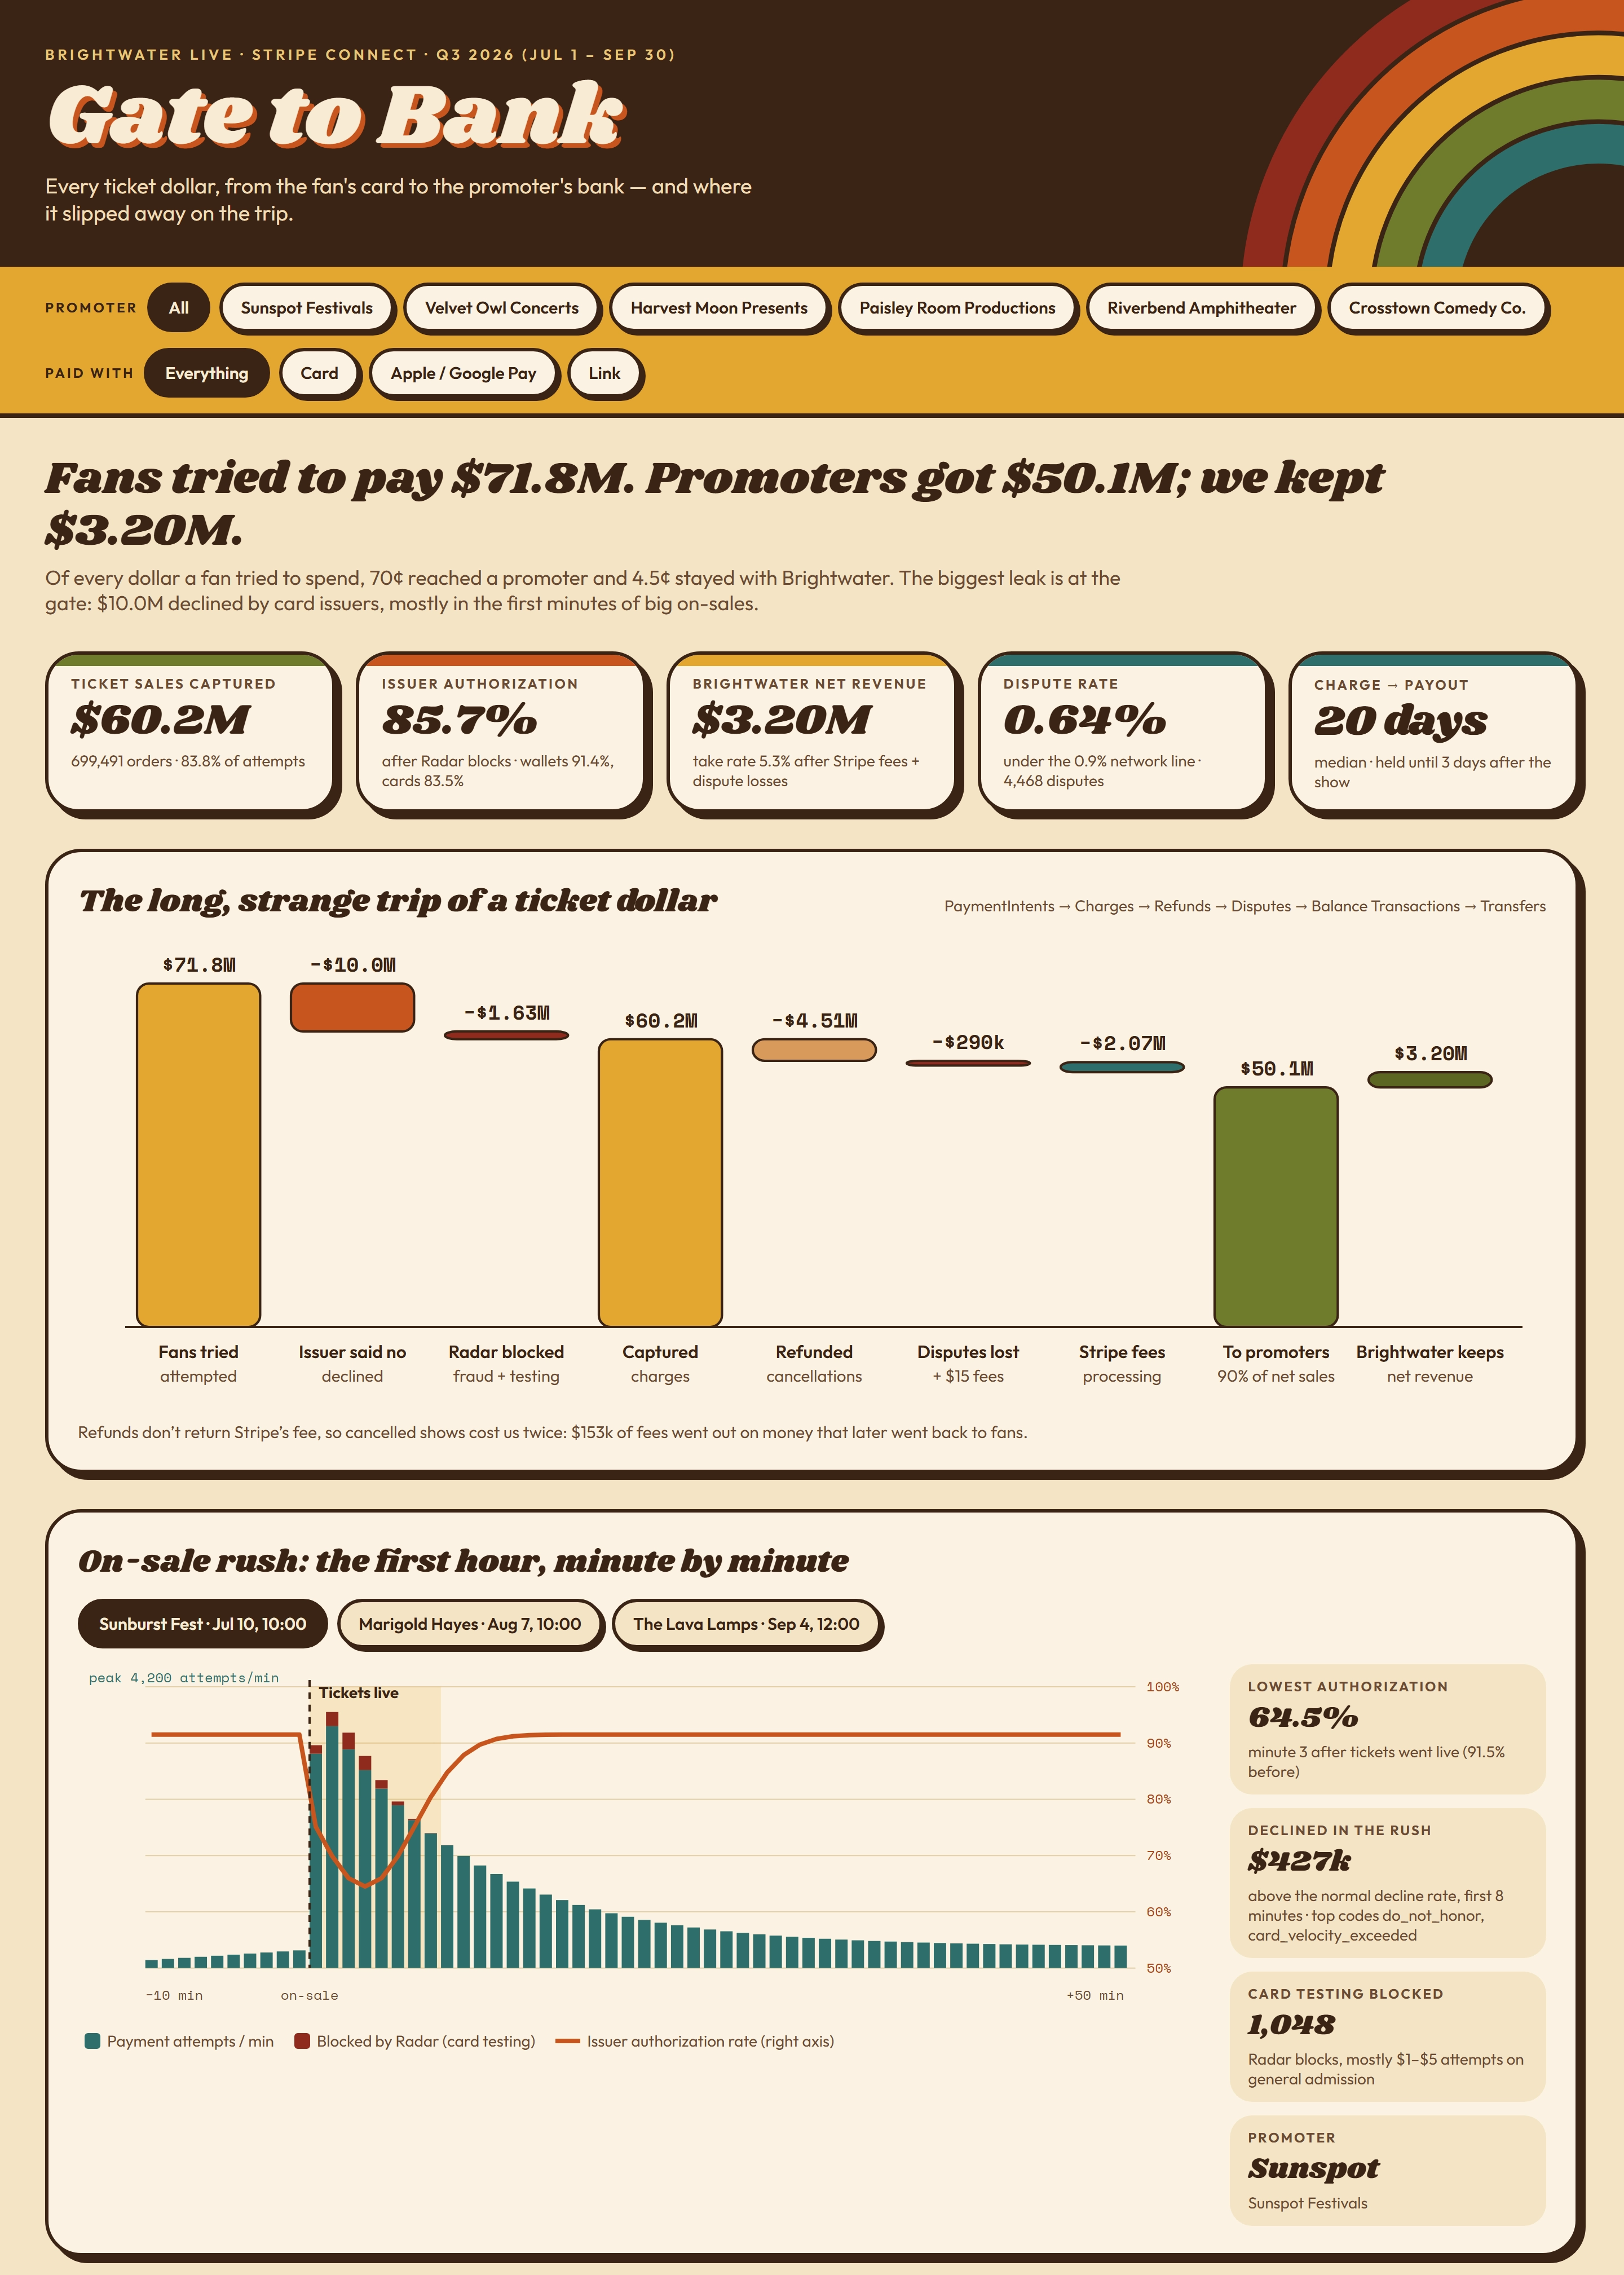
Payment processing dashboards are widely used across industries that depend on digital transactions and recurring payment activity.
- E-commerce retailers
- SaaS providers
- Subscription businesses
- Marketplaces
- Financial technology companies
- Travel and hospitality organizations
- Healthcare providers
- Live event and ticketing platforms
- Gaming companies
- Telecommunications providers
Benefits of Payment Processing Dashboards
Organizations that implement payment processing dashboards gain greater control over revenue operations, financial performance, and customer experience. By consolidating data from gateways, processors, banks, fraud systems, and accounting platforms, these dashboards provide a comprehensive view of the payment lifecycle.
The result is improved transaction success, reduced costs, lower fraud exposure, faster settlements, and better strategic decision-making across the business.

Tracking Payment Performance in Real Time
Payment processing dashboards help organizations understand how money flows from customer transactions through authorization, capture, settlement, refund, and dispute processes. By tracking payment performance in real time, businesses can improve revenue capture, minimize losses, optimize costs, and ensure efficient financial operations. As digital payments continue to grow, payment processing dashboards have become an essential component of modern business intelligence strategies.