Business Scorecard Metrics
In business, a scorecard is a means of assessing the performance of an individual or a company. Scorecard metrics are the measurements used to track and control the progress of this performance.
The intent of these measurements is to ensure that progress remains steady towards a desired future goal.
Scorecard metrics should be specific, measurable, attainable, relevant, and time-constrained (S.M.A.R.T.). Scorecards can most easily be likened to school report cards.
Scorecard Metrics in Action
The foundation of a scorecard is that business does not happen in a vacuum. All aspects of a business are interconnected and all decisions permeate throughout an organization.
Common scorecard metrics are chosen based on different business perspectives such as financial, customer, process, and innovation. They can measure anything from monthly turnover to the installation date of new machinery.

InetSoft's Approach
InetSoft's comprehensive real-time analytical reporting and dashboard software lets user build performance scorecards to monitor, measure, and manage performance by tracking metrics in real-time.
With InetSoft's StyleBI users build scorecards using a collection of objects known as 'Targets'. Each target helps monitor the performance of a metric. It specifies the metric, how and when the metric's performance is evaluated, what the end goal is, and what action to take if the goal is not reached.
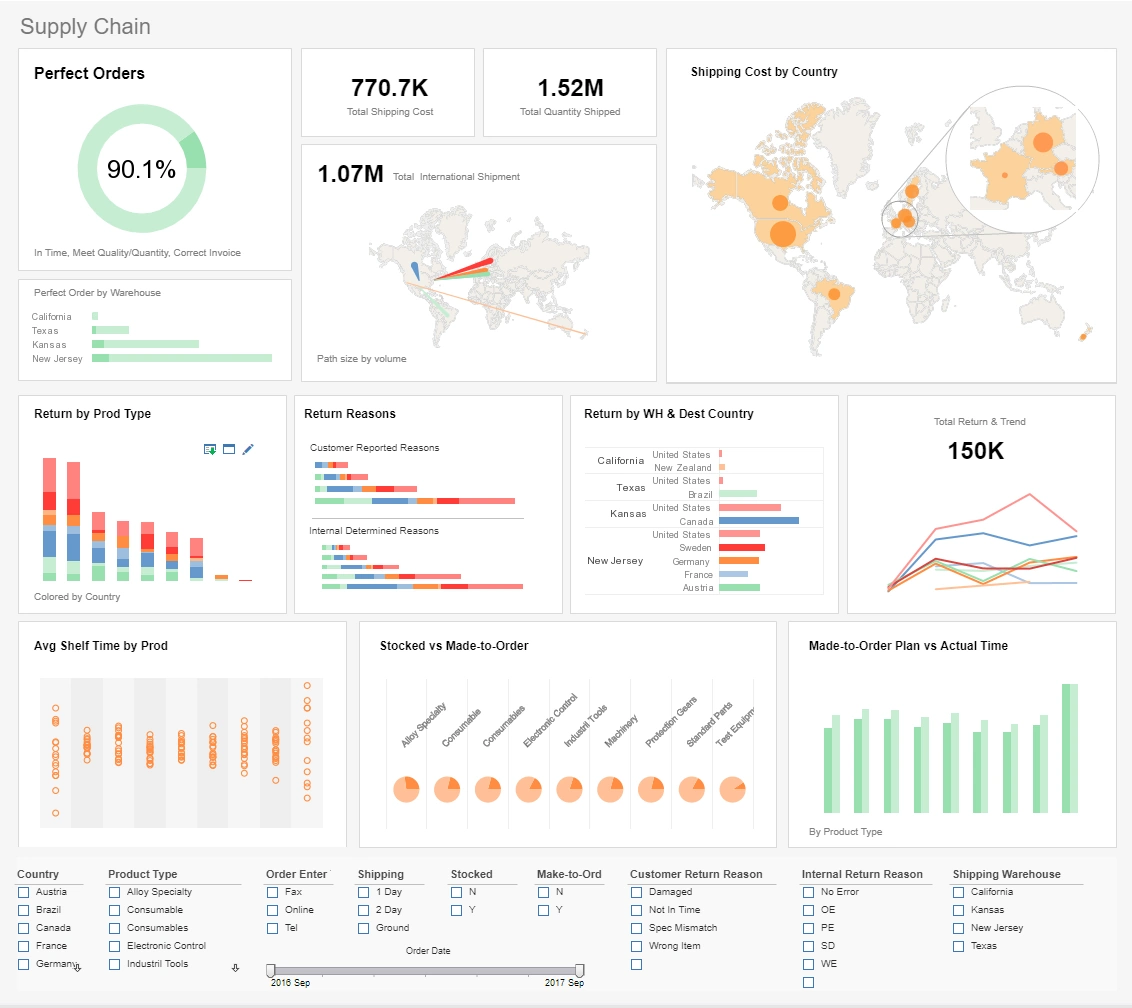
The scorecard provides an easy way to monitor multiple targets on a single page. In addition to checking status, you can drill down on a metric to see more detail, and set up alert notification for a failing metric. View the example below to learn more about the StyleBI solution.
10 InetSoft Articles About Metrics
-
Evaluate InetSoft's Metric Reporting Software
InetSoft’s cloud-native BI delivers drag-and‑drop dashboards tailored to metric monitoring, with top rankings in adoption and ease of implementation. The article highlights self‑service capabilities and interactive demos. It emphasizes data‑block technology for efficient reuse of queries. -
Software for Performance Metrics?
Defines key metrics and KPIs across various industries and explains how InetSoft’s dashboards allow non‑technical users to customize, combine, and transform them without coding. Showcases examples in marketing, sales, supply chain, and HR. -
Online Metrics Dashboard Examples
Provides multiple KPI‑centric dashboard templates, including salesforce examples, manufacturing quality, finance, and balanced scorecards. Illustrates how to visualize and track key business metrics in context. Emphasizes rapid creation via intuitive drag‑drop. -
Business Metrics Software
Discusses how InetSoft enables point‑and‑click creation of intricate performance metric visualizations and scorecards, accessible via browser. Highlights minimal deployment requirements and fast ad‑hoc use for both users and analysts. -
Key Metrics Definition
Explains what constitutes a metric versus a KPI, categorizing their use across industries like finance, marketing, HR, education, and emergency services. Emphasizes contextual benchmarks and goal‑based measurement. -
What Is the Difference Between a Measure and a
Metric?
Clarifies that a metric adds contextual data to a raw measure (e.g., conversions per impressions). Demonstrates how metrics transform basic data into actionable insights. -
Recognizing Business Scorecard Metrics
Describes building real‑time scoreboards in StyleBI using ‘Targets’ to set goals and trigger alerts. Explores how scorecards interconnect financial, customer, process, and innovation metrics. -
Key Metrics Reporting and Performance Indicators
Covers KPI dashboard and reporting tools in StyleBI, detailing examples across departments like marketing, sales, supply chain, HR, and finance. Highlights the platform’s ease of deployment and customization power. -
Tracking Business Intelligence Metrics with a
Dashboard
Outlines StyleBI’s capability to track both soft and hard KPIs through easy‑to‑deploy dashboards and enterprise‑grade BI features. Notes patented data mashup engine and self‑service analytics. -
Try InetSoft's Metrics Dashboard and Scorecard
Application
Introduces robust yet easy-to-use dashboard and scorecard application that deploys within weeks. Focuses on executive-grade visualizations, HTML5 embedding, and reusable Data Block™ mashups.
