A Yoke Manufacturer Uses InetSoft's StyleBI Open Source Reporting Software
InetSoft's StyleBI is a 100% web-based Java reporting tool designed for flexibility and ease of use, making it ideal for manufacturers seeking to streamline reporting processes without heavy reliance on IT expertise. Its drag-and-drop interface, real-time data mashup capabilities, and support for diverse data sources enable manufacturers to create pixel-perfect reports and interactive dashboards. For a yoke manufacturer, StyleBI's ability to integrate with existing enterprise resource planning (ERP) systems, such as SAP or Oracle, and its compatibility with relational databases via JDBC, ensures seamless data aggregation from production lines, supply chains, and quality control systems.
StyleBI's open-source nature allows for cost-effective deployment, with the option to build from source or use a pre-built Docker container. This flexibility is particularly valuable for small to medium-sized manufacturers who need scalable solutions without the high costs associated with proprietary software. Additionally, StyleBI's mobile accessibility and self-service features empower production managers, quality assurance teams, and executives to access real-time insights on the go, enhancing responsiveness to operational challenges.


Key Performance Indicators (KPIs) for Yoke Manufacturing
KPIs are critical for monitoring the performance of yoke manufacturing processes. StyleBI enables manufacturers to define and track KPIs that align with operational and strategic goals. Below are key KPIs relevant to yoke manufacturing, along with how StyleBI visualizes and analyzes them:
- Production Yield Rate: Measures the percentage of yokes meeting quality standards out of total units produced. A low yield rate may indicate issues in raw material quality or machining precision. StyleBI's data mashup engine allows manufacturers to combine production data with quality control metrics to calculate this KPI in real-time.
- Machine Downtime: Tracks the duration equipment is non-operational due to maintenance or failures. StyleBI's real-time integration with IoT-enabled machinery provides instant updates on downtime events, helping identify bottlenecks.
- Defect Rate: Quantifies the number of defective yokes per batch, crucial for quality assurance. StyleBI's Pareto chart functionality helps pinpoint the most common defect causes, such as machining errors or material inconsistencies.
- Order Fulfillment Time: Measures the time from order placement to delivery. StyleBI's interactive dashboards allow tracking of supply chain and production timelines to optimize delivery schedules.
- Inventory Turnover: Assesses how quickly raw materials and finished yokes move through the supply chain. StyleBI's multi-dimensional charting visualizes inventory trends, aiding in demand forecasting.
- Cost Per Unit: Calculates the production cost per yoke, including labor, materials, and overhead. StyleBI's automated calculations aggregate financial data from ERP systems to monitor cost efficiency.
Charts and Visualizations in StyleBI
StyleBI's robust visualization engine, featuring over 30 chart styles, enables manufacturers to present KPIs in a clear and actionable format. Below are examples of charts commonly used in yoke manufacturing reports:
- Pareto Charts: Used to analyze defect rates, Pareto charts highlight the most significant defect causes. For instance, a manufacturer might find that 80% of defects stem from improper machining tolerances, prompting targeted process improvements. StyleBI's drag-and-drop interface simplifies creating these charts by selecting defect data from quality control databases.
- Line Charts: Ideal for tracking production yield rates over time, line charts reveal trends and seasonal variations. Manufacturers can use StyleBI to plot yield rates against production shifts to identify performance patterns.
- Gauge Charts: These provide a snapshot of machine downtime or production efficiency, with customizable thresholds for acceptable performance. StyleBI's gauge charts can be embedded in dashboards for real-time monitoring.
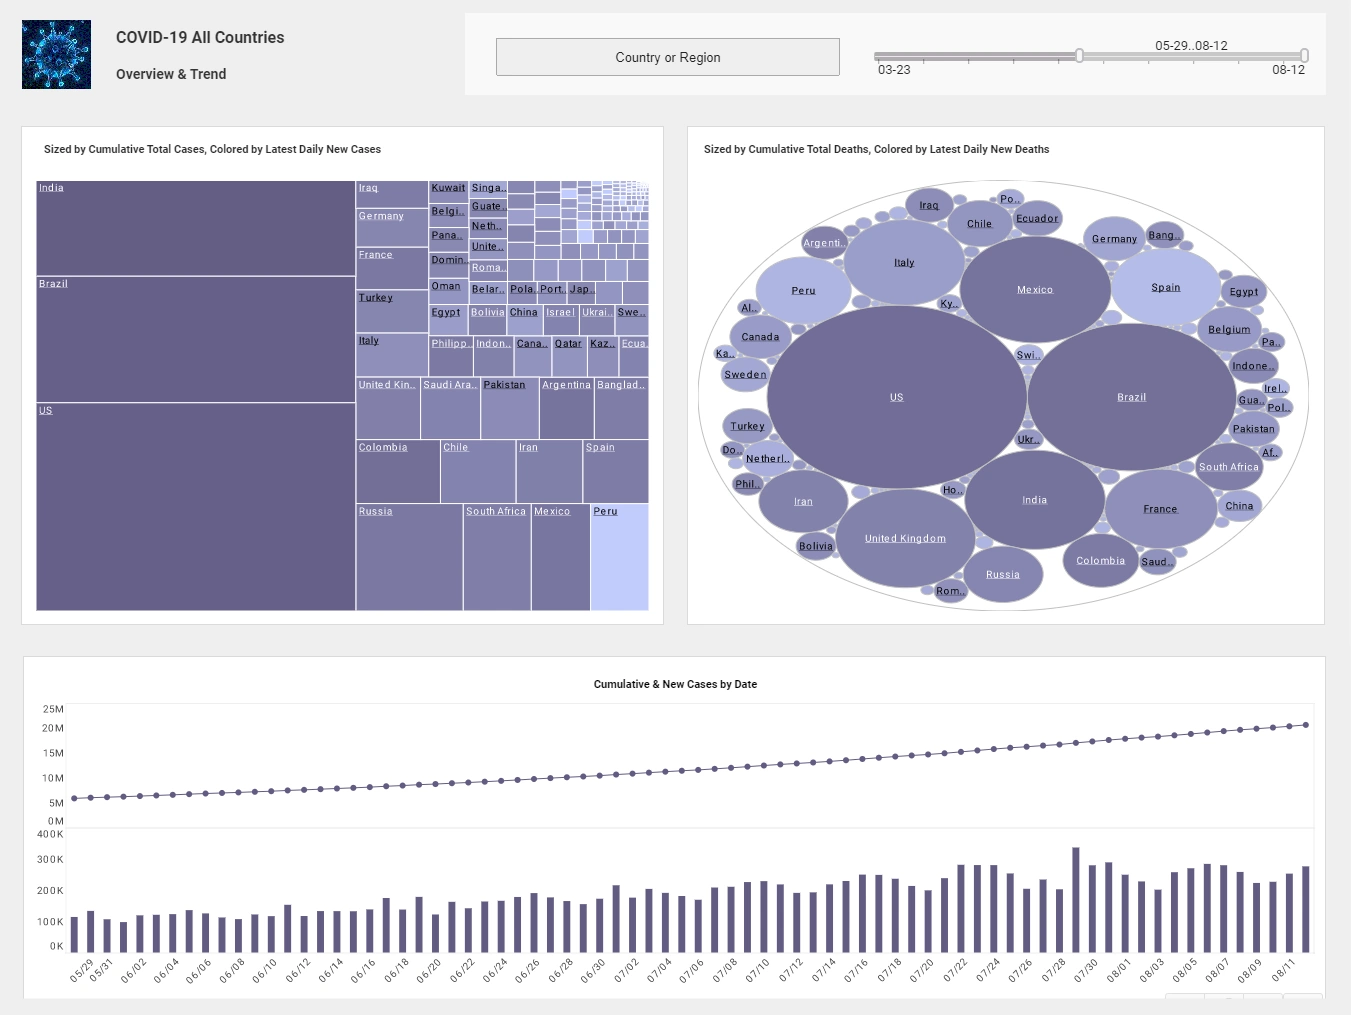
- Bar Charts: Multi-dimensional bar charts display inventory turnover by material type or yoke model, helping manufacturers optimize stock levels. StyleBI's brushing feature allows cross-chart highlighting to correlate inventory data with production schedules.
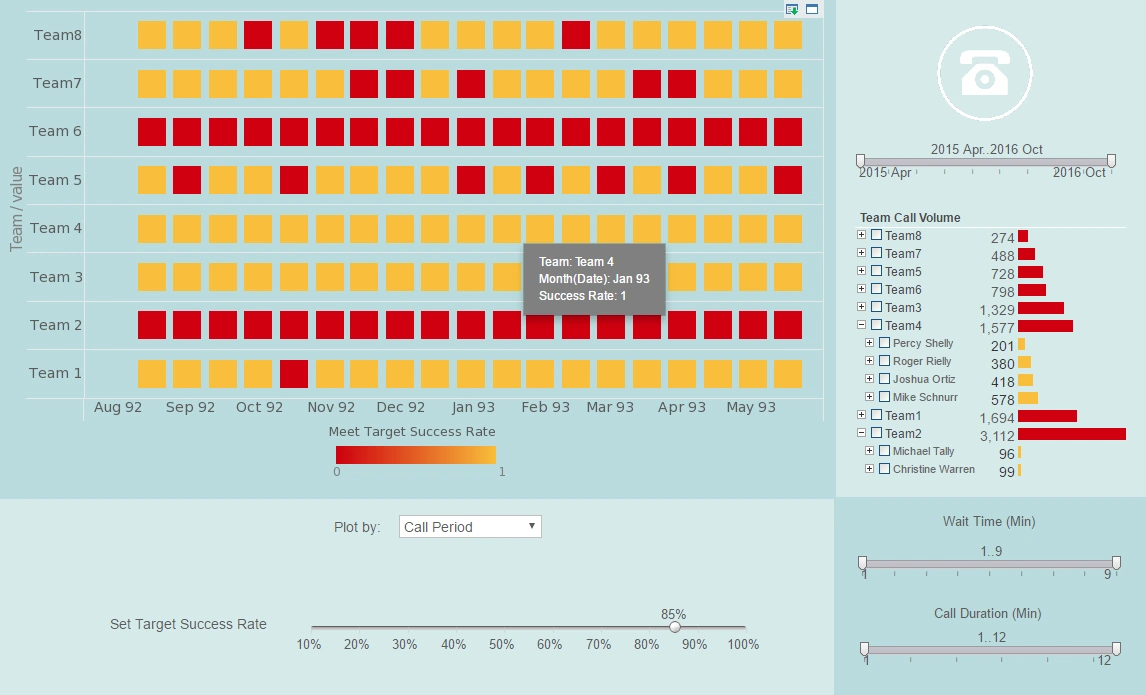
- Heat Maps: Used to visualize order fulfillment times across different regions or customers, heat maps help identify delays in specific supply chain segments. StyleBI's data mashup capabilities integrate logistics data for comprehensive analysis.
StyleBI's interactive features, such as drill-down capabilities and range sliders, allow users to explore data dynamically. For example, a production manager can drill into a bar chart to view defect rates by specific machines or shifts, enabling rapid identification of issues.
Reports for Yoke Manufacturing
StyleBI supports a range of report types, from pixel-perfect paginated reports to ad hoc analyses, tailored to different stakeholders in yoke manufacturing. Below are examples of reports generated using StyleBI:
- Production Summary Report: A paginated PDF report, automatically distributed daily to executives, summarizing production output, yield rates, and machine uptime. StyleBI's bursting feature ensures each manager receives only relevant data, such as metrics for their specific production line.
- Quality Control Ad Hoc Report: Quality assurance teams use StyleBI's wizard-driven interface to generate ad hoc reports filtering defect data by date, yoke type, or production batch. This flexibility supports rapid response to quality issues.
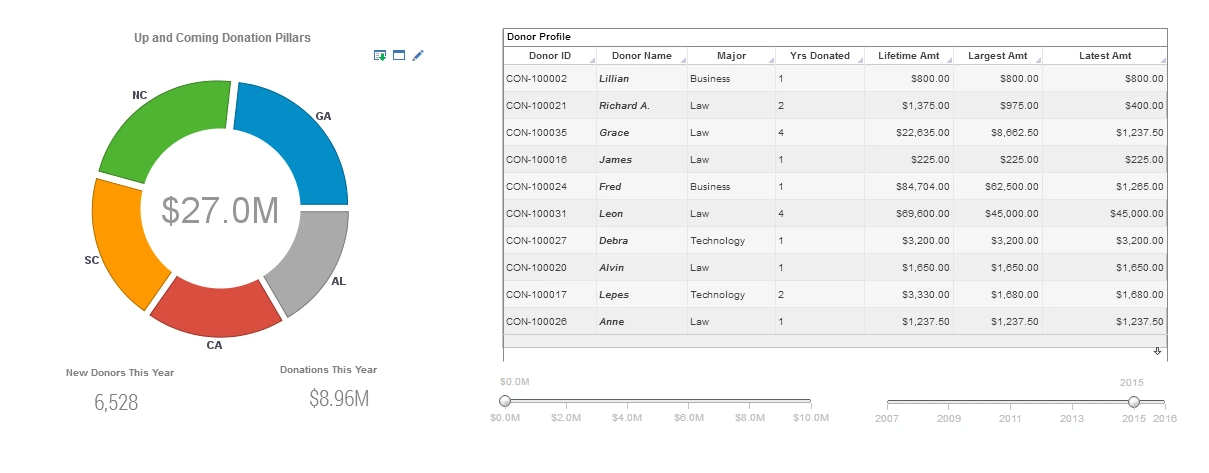
- Supply Chain Dashboard: An interactive web-based dashboard displaying real-time KPIs like order fulfillment time and inventory turnover. Managers can use sliders and selection lists to filter data by customer or region, optimizing logistics decisions.
- Cost Analysis Report: A detailed report combining financial data from ERP systems with production metrics to calculate cost per unit. StyleBI's data streaming ensures large datasets load quickly, allowing managers to view cost trends without delays.
StyleBI's report designer supports exporting to Excel, PDF, and PowerPoint, ensuring compatibility with existing workflows. Additionally, reports can be embedded into web pages or accessed via mobile devices, enhancing accessibility for field supervisors.
Implementation and Benefits
Implementing StyleBI in a yoke manufacturing environment is straightforward due to its web-based architecture and minimal IT requirements. The platform's drag-and-drop designer and Excel-like interface reduce the learning curve, enabling production staff to create reports without coding expertise. StyleBI's data block technology allows IT teams to create secure, performance-tuned data models that business users can manipulate for real-time queries.
The benefits of using StyleBI include:
- Cost Efficiency: As an open-source solution, StyleBI reduces licensing costs compared to proprietary BI tools like Tableau or Power BI.
- Scalability: Deployable on Docker Desktop or cloud platforms, StyleBI scales with the manufacturer's growth.
- Real-Time Insights: Integration with IoT and ERP systems ensures up-to-date KPIs, enabling proactive decision-making.
- User Empowerment: Self-service features reduce IT dependency, allowing production and quality teams to generate custom reports.
Customer Comments
"With InetSoft’s Style Report, we are able to provide our customers with additional advanced business reporting tools to analyze data and make better business decisions. This strengthens the solutions we are able to offer P&C and workers’ compensation insurers." - Priscilla Hung, Vice President of Alliances at Guidewire Software
"Style Report’s powerful analytic tools and ad hoc reporting tools are the perfect complement to our market-leading risk management system. Giving our customers secure access to their critical business data in real-time provides them a considerable competitive advantage and equates to significant annual savings." - Juan Ramón Romero, CEO of Align Kpital
“We evaluated many reporting vendors and were most impressed at the speed with which the proof of concept could be developed. We found InetSoft to be the best option to meet our business requirements and integrate with our own technology.” - John White, Senior Director, Information Technology at Livingston International
“ComTrac contains 280 reports, most of which can be run from custom selection screens, Web services, or from our custom Job Scheduler. If a customer cannot get to their data, it is a big problem. With the use of InetSoft's reporting tool, we have been able to not only meet the needs of our customers with simple reports, but with complex ones as well. Our ability to report effectively has been a deciding factor in some of our most successful sales and thus has allowed us to gain a tremendous benefit.” - Chris Bombei, VP of Sales & Delivery for Products at Fusion Alliance