What KPIs and Analytics Are Used on Revenue Cycle Management Dashboards?
A critical component of maintaining the financial stability of healthcare businesses is revenue cycle management, or RCM. Organizations use complicated dashboards with analytics and Key Performance Indicators (KPIs) to effectively manage the intricacies of revenue cycles.
These resources provide priceless insights into the organization's financial health and support decision-making by stakeholders.
This article examines Revenue Cycle Management dashboard KPIs and analytics and their use in financial process optimization.
 Explore the InetSoft
Gallery
Explore the InetSoft
Gallery

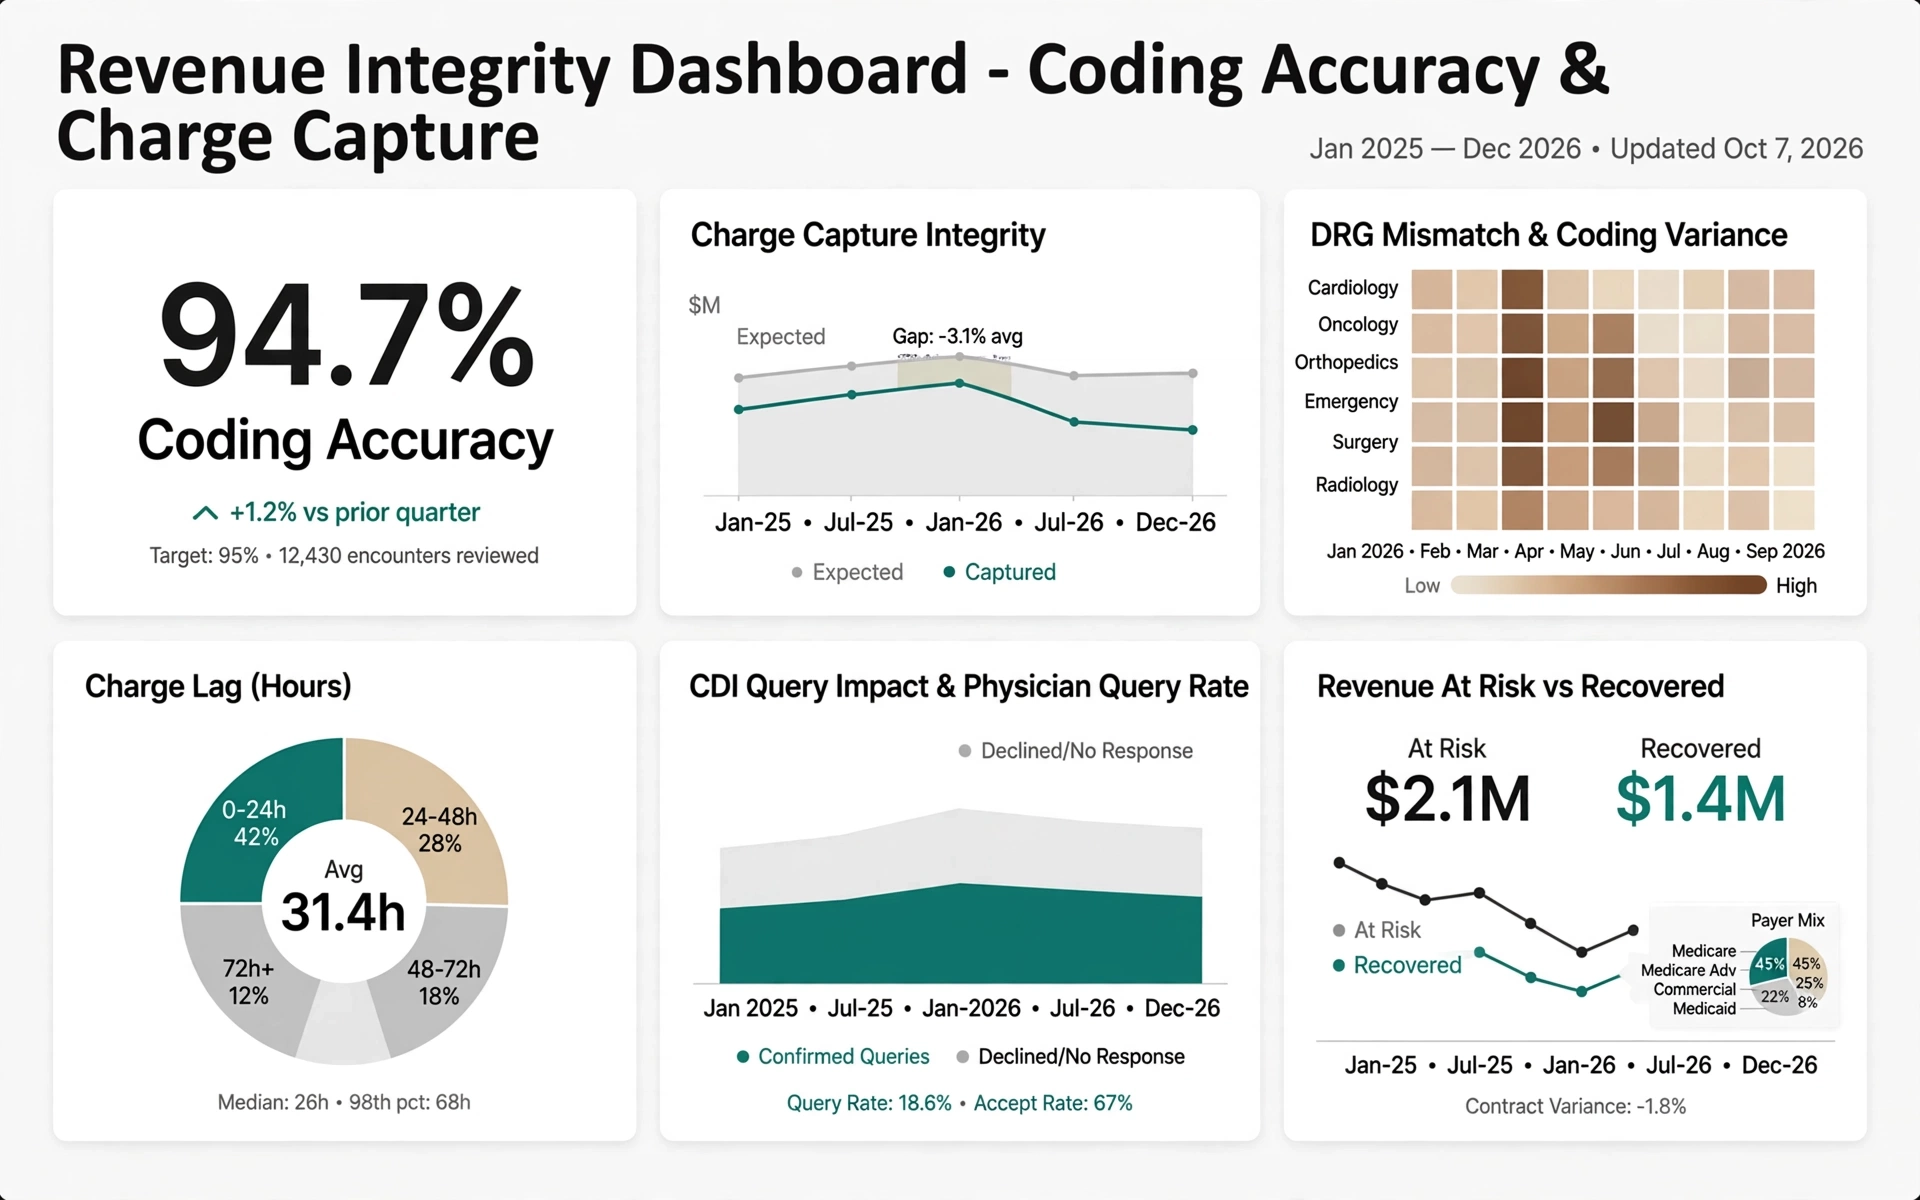
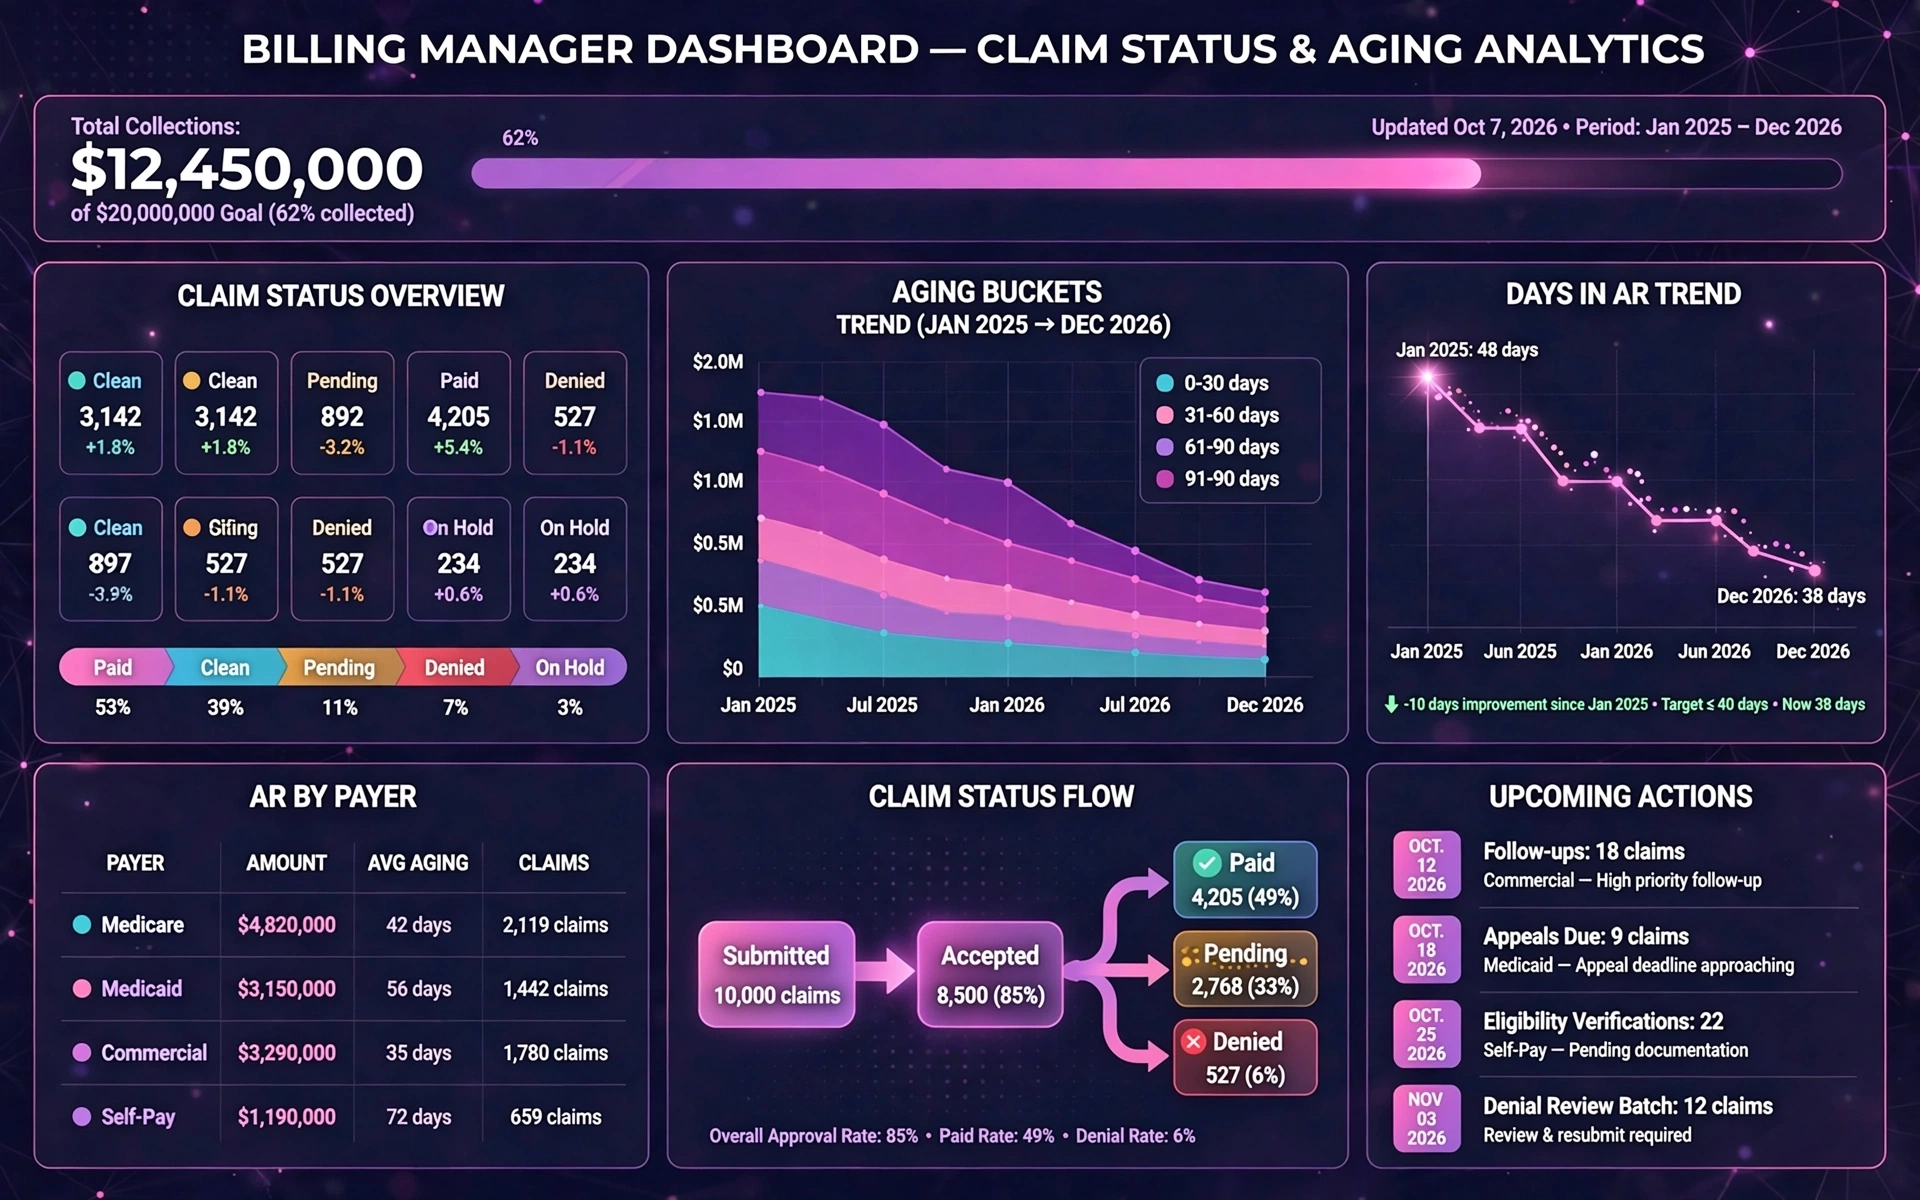
Days in Accounts Receivable (DAR)
Days in Accounts Receivable (DAR) is one of the core KPIs in dashboards for revenue cycle management. The average number of days it takes a healthcare company to be paid after rendering services is measured by this KPI. A lower DAR suggests that the company is collecting payments on time and has a more effective revenue cycle. If DAR is high, billing and collections concerns may be present, requiring firms to explore and fix inefficiencies to improve cash flow.
First Pass Acceptance Rate
The effectiveness of the billing process is evaluated by the First Pass Acceptance Rate, a crucial Key Performance Indicator. It shows the proportion of claims that payers approve without asking for more information or resubmissions. A better billing procedure is indicated by a greater first pass acceptance rate, which lowers the possibility of late payments and denied claims. Healthcare companies may reduce the risk of revenue loss from billing mistakes and increase revenue cycle efficiency by tracking and optimizing this statistic.
Denial Rate
A crucial metric for evaluating how well a healthcare company submits and processes claims is its denial rate. This measure indicates the proportion of claims that payers reject, suggesting possible problems with coding, paperwork, or other areas of the invoicing process. Monitoring the Denial Rate helps firms identify areas for improvement, take remedial action, and minimize refused claims, boosting income.
Net Collection Rate
A comprehensive measure that evaluates an organization's revenue cycle's efficacy from a financial standpoint is the net collection rate. The proportion of revenue collected is computed subsequent to the deduction of modifications, denials, and contractual allowances. A low Net Collection Rate may suggest billing, collections, or payer contract difficulties, whereas a high rate implies effective revenue cycle management. Organizations may find areas for improvement and put measures in place to optimize revenue collection by keeping an eye on this KPI.

Charge Entry Lag
Charge Entry Lag, the time it takes from healthcare service delivery to billing system entry, is a critical operational statistic. A shorter charge entry lag indicates a more efficient billing procedure, which lowers the possibility of late claim submission and maximizes revenue cycle effectiveness. Organizations may speed up the revenue cycle and enhance their financial performance by continuously monitoring and decreasing charge entry latency.
Accounts Receivable (AR) Aging
Accounts Receivable Aging is a detailed study that ranks outstanding receivables by length of time. This indicator shows how outstanding balances are distributed within several aging buckets, giving an overview of the organization's financial health. By assessing AR aging, healthcare companies may detect issues, prioritize collections, and minimize AR aging to improve cash flow.
Collection Effectiveness Index (CEI)
An organization's ability to collect effectively is measured by a performance statistic called the Collection Effectiveness Index (CEI). It calculates the proportion of charged amounts that are paid for within a certain period of time. A lower CEI might point to difficulties in collecting unpaid accounts, while a higher CEI suggests a successful and effective collections operation. Healthcare businesses may assess their collections techniques and make data-driven changes to improve financial performance by monitoring the CEI.
Patient Satisfaction Scores
Although conventional financial measurements remain crucial, in healthcare practices, patient happiness has become more and more important in recent years. Patient satisfaction scores, frequently determined by surveys, reveal the complete patient experience, including billing and financial procedures. Patients who are satisfied are more likely to pay their bills on time, which lowers the possibility of bad debt and strengthens the organization's finances. Financial performance and a good patient experience may be linked for businesses by integrating patient satisfaction ratings into revenue cycle management dashboards.

Clean Claim Rate
A crucial KPI called the Clean Claim Rate evaluates the proportion of claims that are sent to payers' error-free or with no inconsistencies. Reduced chances of claim rejections and delays are indicated by a high clean claim rate, which is a sign of an efficient billing process. This statistic helps firms optimize coding, documentation, and billing, expediting the revenue cycle and claims processing.
Average Reimbursement Time
Average Reimbursement Time is a significant indicator that shows how long payers often take to reimburse healthcare organizations after filing a claim. This KPI shows reimbursement efficiency and helps firms discover bottlenecks that cause delays. Organizations can maintain timely financial stability, boost liquidity, and speed cash flow by decreasing the average reimbursement time.
Payer Mix Analysis
Examining the patient and revenue distribution among various payers, including self-pay, government programs, and commercial insurance, is known as payer mix analysis. Revenue cycle managers must understand the payer mix to evaluate their dependency on individual payers and predict reimbursement rate changes. Through smart decision-making, companies may diversify their payer mix and reduce financial risks from reimbursement policy changes.

Patient Financial Responsibility Ratio
Patient Financial accountability Ratio monitoring is essential as patient accountability for healthcare expenditures rises. This KPI calculates the portion of total income that is generated by patients directly, including amounts paid out of pocket as well as copayments and deductibles. A greater patient financial responsibility ratio might be a sign that better collections techniques or more patient education are required. Healthcare companies may modify their revenue cycle strategies to conform to changing patient payment dynamics by comprehending and controlling this ratio.
Registration Accuracy Rate
One KPI that assesses the accuracy of patient data gathered during the registration process is the Registration Accuracy Rate. The revenue cycle depends on accurate patient data since registration mistakes might result in claim rejections and payment delays. This measure evaluates the proportion of patient records that are error-free, guaranteeing that billing data is accurate from the start. Healthcare businesses may improve overall revenue cycle efficiency, decrease billing mistakes, and reduce rework by maintaining a high registration accuracy rate.
Appeals Success Rate
One important indicator for assessing how well an organization's appeals procedure overturns rejected claims is the Appeals Success Rate. Claim rejections may still happen even with the greatest of intentions, which is why the appeals procedure is an essential part of revenue cycle management. This KPI calculates the proportion of rejected claims that are successfully appealed and then paid back. High appeals success rates suggest a strong framework for disputing rejections, enabling firms to recover lost money. The performance of the revenue cycle as a whole may be greatly enhanced by tracking and optimizing this statistic.
End-to-End Revenue Cycle Workflow
Revenue cycle management spans the entire journey from patient scheduling to final payment and reconciliation. Understanding this workflow is essential for designing effective dashboards that highlight bottlenecks and opportunities for improvement.
1. Patient Scheduling
The process begins when a patient is scheduled for an appointment or procedure. Dashboards can track scheduling volume, cancellations, and no-show rates.
2. Registration & Eligibility
Accurate registration and insurance eligibility verification reduce downstream denials. Metrics include eligibility checks completed and registration error rates.
3. Charge Capture
Services provided must be captured as billable charges. Dashboards monitor charge lag, missing charges, and discrepancies between clinical documentation and billing.
4. Coding
Proper coding ensures that claims reflect the services rendered. Coding accuracy, coding turnaround time, and audit findings are key indicators.
5. Claim Submission
Claims are submitted to payers for reimbursement. Dashboards track clean claim rate, submission timeliness, and claim volume by payer.
6. Payment Posting
Payments and adjustments are posted to patient accounts. Metrics include posting timeliness, unapplied cash, and variance between expected and actual payments.
7. Denials Management
Denied claims are analyzed, corrected, and resubmitted when appropriate. Dashboards highlight denial rates, denial reasons, and recovery performance.
8. Collections & Final Resolution
Remaining balances are pursued through internal collections or external agencies. Aging buckets, collection effectiveness, and bad debt rates are central measures.
Payer Mix & Contract Performance
Payer mix and contract performance have a direct impact on revenue, margins, and financial stability. Dashboards provide visibility into how different payers contribute to overall results.
Payer Mix Visualization
Dashboards can show the distribution of revenue and volume across commercial, government, and self-pay segments. This helps organizations understand their exposure and risk.
Contract Variance Tracking
Comparing expected reimbursement to actual payments reveals underpayments and contract compliance issues. Variance dashboards highlight where renegotiation or follow-up is needed.
Out-of-Network vs In-Network Trends
Monitoring out-of-network encounters and their financial impact helps organizations manage risk and patient communication around coverage.
Payer Performance Metrics
Key metrics include average payment time, denial rates by payer, and net collection rate. These indicators support strategic decisions about contracts and payer relationships.
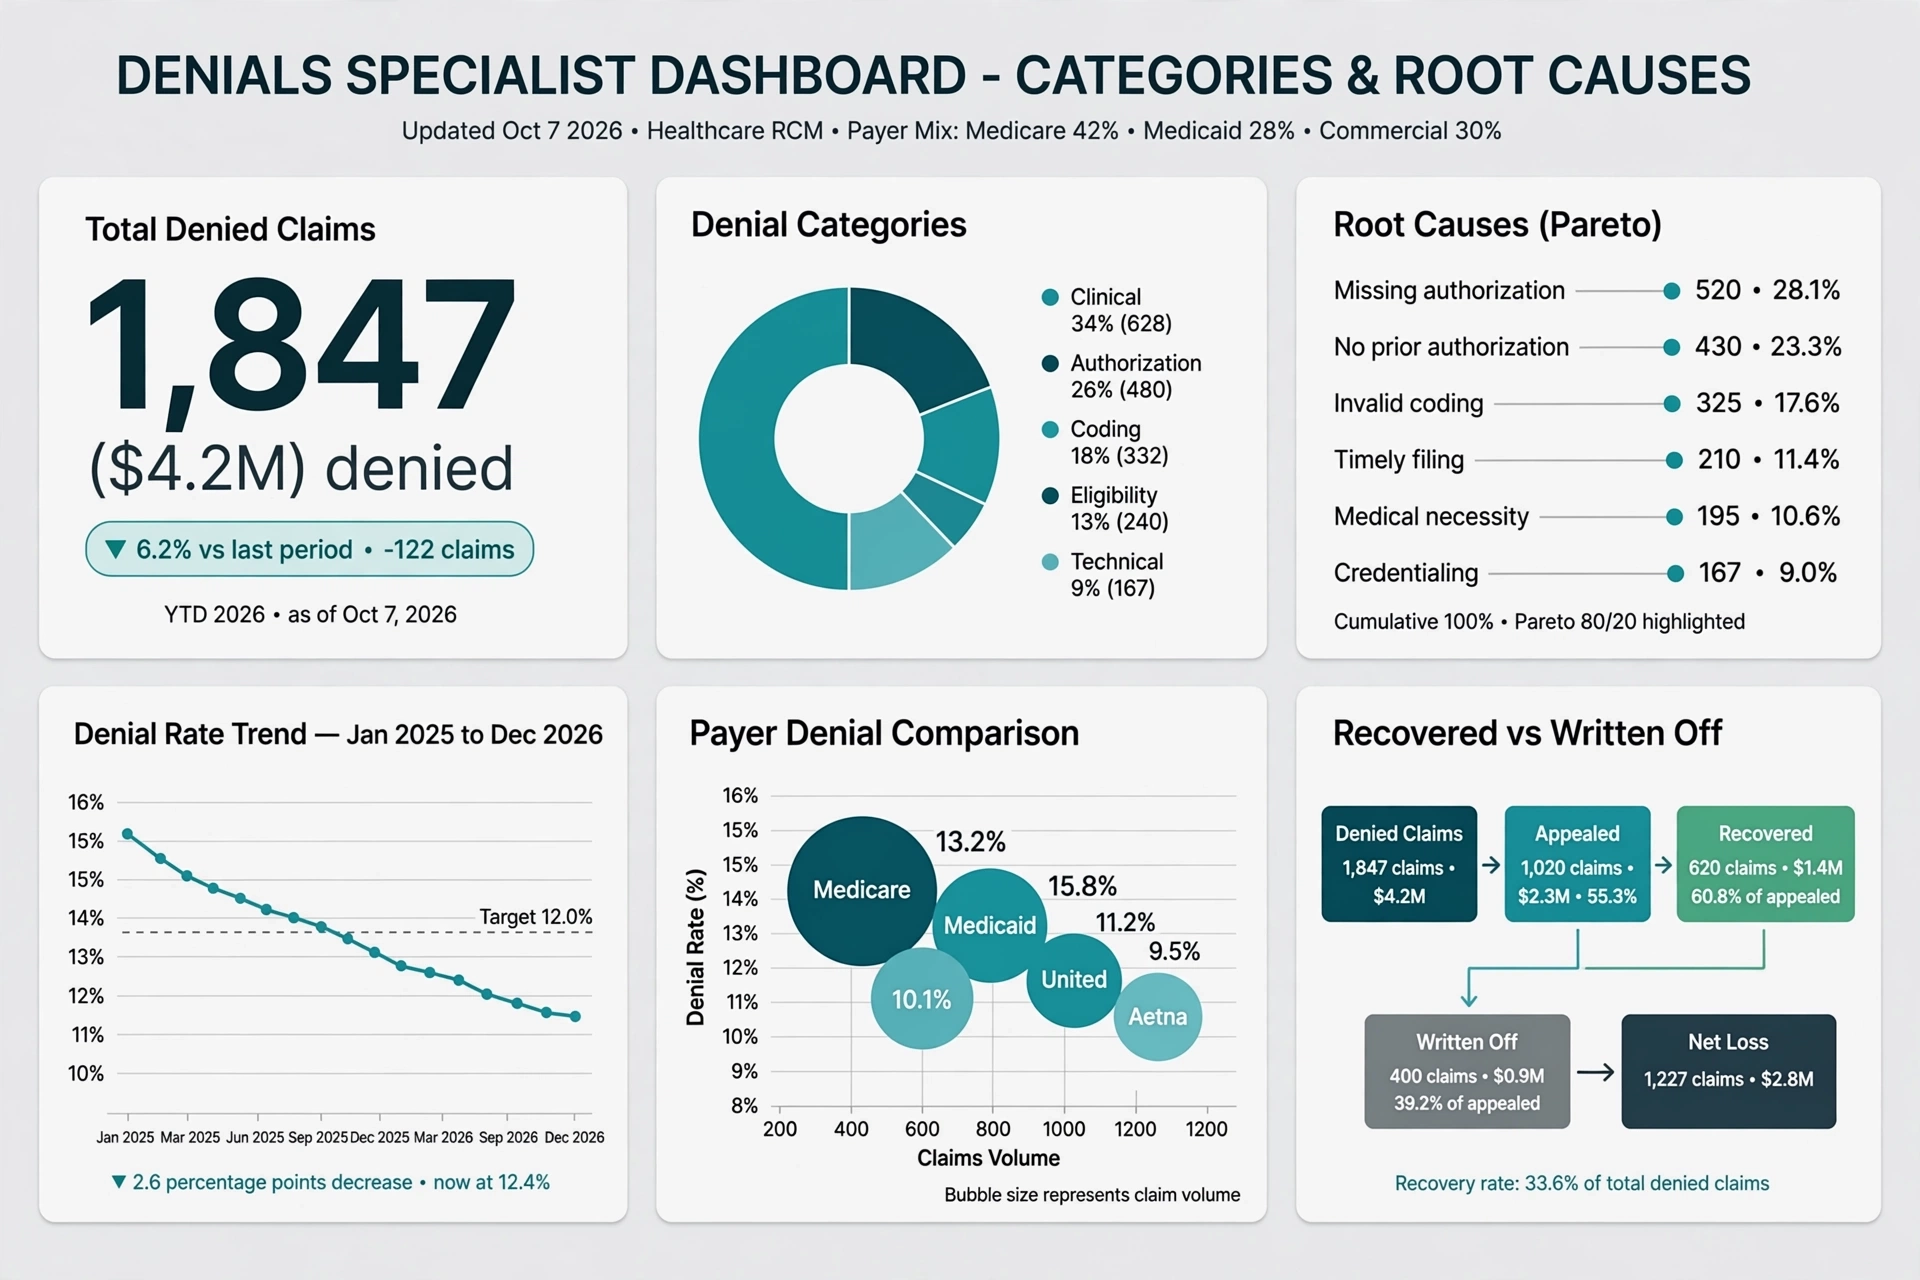
Denials Management Deep Dive
Denials represent lost or delayed revenue and increased administrative effort. A focused denials dashboard helps organizations identify root causes and prioritize corrective actions.
Top Denial Categories
Dashboards can group denials by category, such as eligibility, coding, medical necessity, and timely filing. This categorization guides targeted interventions.
Root Cause Analysis
By linking denials to specific workflow steps, organizations can determine whether issues stem from registration, documentation, coding, or payer rules.
Preventable vs Non-Preventable Denials
Separating preventable denials from those driven by payer policies helps focus improvement efforts where they will have the greatest impact.
Financial Impact of Denials
Dashboards can quantify the revenue at risk due to denials, including recovered amounts and write-offs, to support prioritization and resource allocation.
Appeals Workflow
Tracking appeal status, success rates, and turnaround times provides insight into the effectiveness of the denials management process.

Data Sources & Integration Requirements
Revenue cycle dashboards rely on data from multiple systems. Effective integration ensures that metrics are accurate, timely, and consistent across the organization.
Electronic Health Record (EHR)
Clinical encounters, orders, and documentation originate in the EHR. These data elements support charge capture and coding accuracy.
Practice Management System
Scheduling, registration, and billing workflows are often managed in a practice management system. Dashboards use this data to track patient access and front-end performance.
Clearinghouse
Claim status, rejections, and payer responses flow through clearinghouse systems. Integrating this data enables real-time visibility into claim processing.
Contract Management System
Contract terms and expected reimbursement rates are stored in contract management tools. These values are essential for variance and underpayment analysis.
General Ledger & Financial Systems
Financial postings and reconciliations reside in accounting systems. Linking operational metrics to financial results provides a complete view of performance.
InetSoft’s Integration Approach
InetSoft connects to these systems and provides a modeling layer that standardizes data, defines metrics, and supports consistent reporting across dashboards and scheduled reports.

Why InetSoft for RCM Dashboards
InetSoft offers a flexible, enterprise-ready platform for building revenue cycle dashboards that align with organizational goals and regulatory requirements.
Healthcare-Focused Data Modeling
InetSoft allows organizations to define encounters, claims, payments, and denials in a way that reflects their specific workflows and reporting needs.
Pixel-Perfect Reporting
The platform supports highly formatted reports for compliance, board presentations, and external stakeholders, ensuring that critical information is presented clearly.
Role-Based Dashboards
Dashboards can be tailored for executives, billing managers, denials specialists, and collections teams, each with metrics and views relevant to their responsibilities.
Multi-Source Integration
InetSoft brings together data from EHRs, practice management systems, clearinghouses, and financial systems, creating a unified view of the revenue cycle.
Automated Alerts & Scheduling
Organizations can configure alerts for threshold breaches and schedule recurring reports, ensuring that stakeholders receive timely information without manual effort.
RCM Dashboard vs Traditional Billing Reports
Revenue cycle dashboards provide a dynamic, integrated view of performance, while traditional billing reports often focus on static snapshots and isolated metrics. The structure below highlights key differences.

RCM Dashboard FAQs
What KPIs should a revenue cycle management dashboard track?
Common KPIs include clean claim rate, first-pass resolution rate, days in accounts receivable, denial rate, net collection rate, charge lag, and bad debt rate. The exact mix depends on organizational priorities.
How do dashboards help reduce denials?
Dashboards highlight denial trends, categorize denials by reason, and link them to specific workflow steps. This visibility supports targeted process improvements and more effective appeals.
What is the best way to visualize A/R aging?
Aging buckets such as 0–30, 31–60, 61–90, 91–120, and 120+ days can be displayed as bar charts or stacked visuals, segmented by payer or financial class to show where risk is concentrated.
How do RCM dashboards support executives like CFOs?
Executive dashboards provide high-level views of cash flow, net collections, payer mix, and trends over time, enabling strategic decisions without requiring detailed operational analysis.
What data sources typically feed an RCM dashboard?
RCM dashboards usually draw from the EHR, practice management system, clearinghouse, contract management tools, and financial systems, combined into a unified data model.
How often should revenue cycle dashboards refresh?
Many organizations refresh operational dashboards daily or near real-time, while executive summaries may be updated weekly or monthly depending on reporting cycles.
Why choose InetSoft for revenue cycle dashboards?
InetSoft offers flexible data modeling, multi-source integration, role-based dashboards, and automated scheduling, making it well-suited for healthcare organizations seeking a comprehensive view of their revenue cycle.