The Hidden Value of Activity-Based Metrics in Salesforce Reporting: Beyond the Opportunity Pipeline
Salesforce is a powerful CRM platform, but many organizations underutilize its potential by focusing solely on outcome-based metrics like closed deals and revenue forecasts. While these are critical, they often overlook the wealth of activity-level data that can provide deeper insights into sales performance.
By analyzing activities such as calls, emails, meetings, and tasks, sales teams can uncover patterns that lead to better decision-making and improved sales strategies. This article explores how to leverage activity-based metrics in Salesforce reporting to drive sales success.
In Salesforce reporting, most sales operations teams build their dashboards and analytics around pipeline stages, deal value, and revenue projections. These are the classic trailing indicators—the outcomes of countless hours of prospecting, demos, and follow-ups. But behind every closed deal is a pattern of activity that can, and should, be measured. Unfortunately, this activity-level data is often treated as noise rather than a strategic asset.
Why Activity-Based Metrics Are Often Ignored
Despite Salesforce’s capability to track emails, calls, meetings, and tasks, many organizations fail to surface these elements in executive-level dashboards. The reason is simple: activity data is messy. Not all reps log it consistently, and sales managers often prioritize outcome-driven KPIs to meet quota goals. But this oversight ignores a treasure trove of predictive insight.
Leading Indicators of Sales Success
Activity-based metrics are the behavioral breadcrumbs of high performance. Reps who follow a consistent cadence—responding quickly to leads, performing follow-ups within 24 hours, scheduling multiple meetings per deal—often outperform their peers. By surfacing metrics such as:
- Lead response time
- Follow-up frequency per opportunity
- Emails and calls per stage
- Average duration between touches
- Meeting-to-deal conversion rate
...sales leaders can gain insight into process efficiency, coaching needs, and pipeline health far earlier than traditional reporting allows.
Designing Reports That Surface Behavior
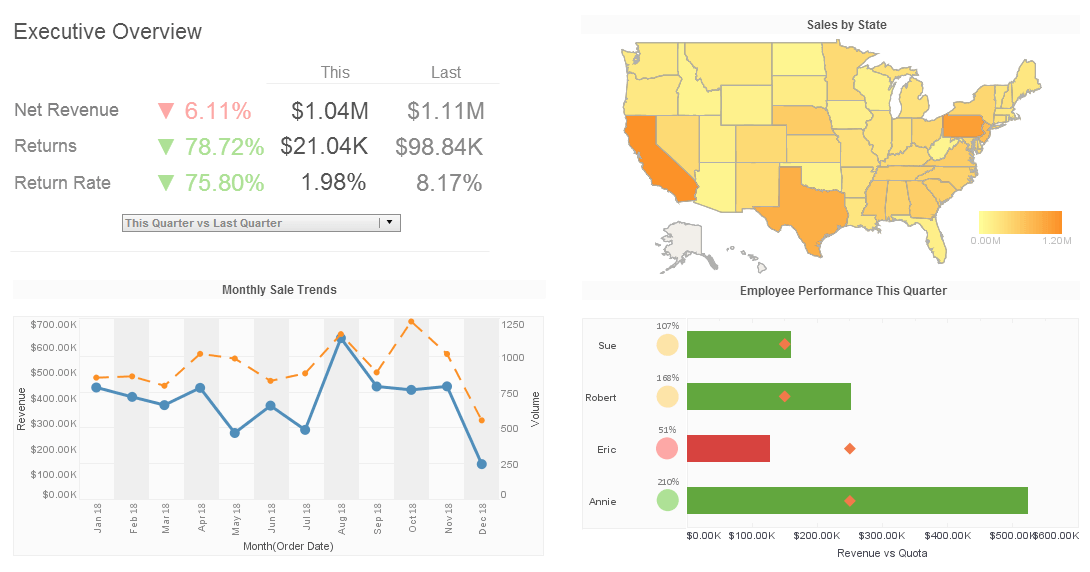
Salesforce's native reporting tools can support activity-focused dashboards, but they often require thoughtful customization. Using tools like report types that include Activities with Opportunities, or integrating external BI platforms such as InetSoft's StyleBI, teams can mash up behavioral data with revenue outcomes. This allows organizations to create dashboards that show not just what’s happening in the pipeline, but why it’s happening.
For instance, a dashboard might show the average deal size by rep alongside average touches per deal. Or show win rates by response time brackets. This level of analysis arms managers with targeted coaching insights rather than blanket advice.
The Twist: Is More Activity Always Better?
It’s tempting to assume that more logged activity equals better performance, but quantity doesn't always translate to quality. One rep might send 30 emails that go unanswered, while another secures a demo with just two personalized touches. That’s why it’s critical to measure activity in context.
Metrics like conversion rate per activity, average deal velocity, or opportunity value per engagement give deeper insight than raw activity counts. In fact, over-emphasis on activity quantity can backfire—leading to performative behavior and dashboard gaming. A balanced approach considers both the volume and the strategic effectiveness of rep actions.
