Upgrading from Excel Dashboards | Reasons to Evaluate InetSoft
Every business starts out using Excel for the dashboards. It's an inexpensive option. Everyone knows how to use Excel. While the software might be 'free' since you already own it, it certainly costs a lot to maintain these Excel dashboards.
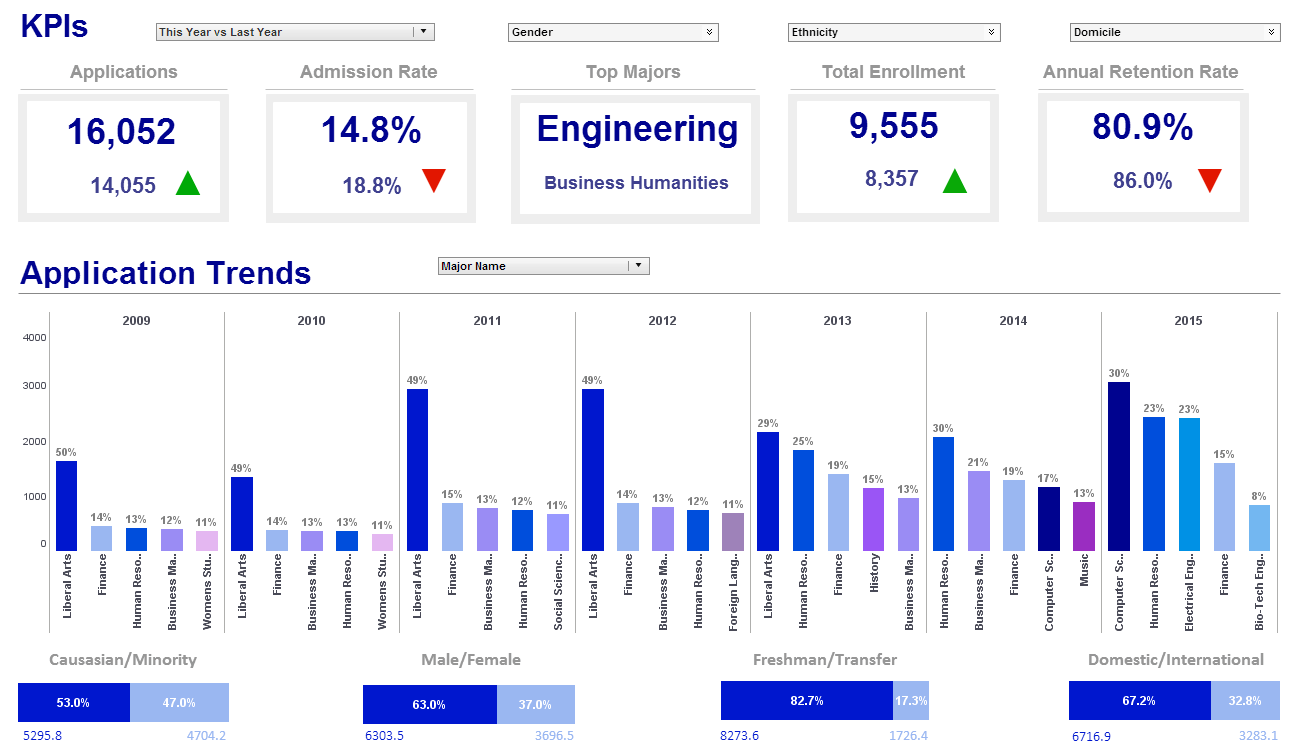
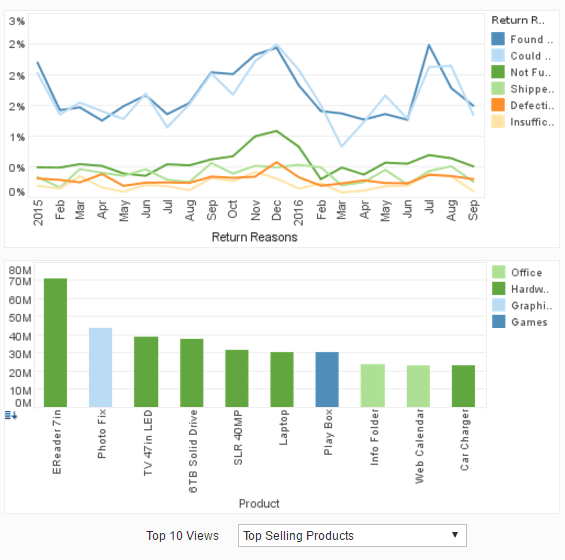
With an affordable investment in InetSoft dashboard reporting application, you can build dashboards and visual analyses that automatically update from your source systems eliminating all the time spent and errors produced from manually updating them.
InetSoft offers a free evaluation and assistance setting up the software either in your network or hosted in the cloud at Amazon.


The Top 10 Problems with Excel Dashboards
- It's a manual process to update the dashboards with new data.
- Manual processes take up someone's time, so even the software is 'free', it's costing human resource time (salary & benefits) anywhere from a few hours a week to the equivalent of several days.
- They're error-prone. You can easily make a mistake even if you're simply copying and pasting the data from some other report into a spreadsheet. That introduces the risk that someone makes a bad decision based on bad information, or wastes time unnecessarily worrying about an incorrect observation.
- The dashboards are not ready first-thing in the morning since you have to wait for the staffer to perform those manual tasks. You may be waiting until after lunch to see what happened yesterday, slowing response time to problems that have cropped up.
- You're over dependent on that staffer. What if they get sick, take vacation, or just have a morning meeting? The dashboard doesn't get done. You can cross-train a back-up, but now you're spending even more human resource expense.
- There is no interactivity. All you get are static charts and tables. No drill through or data exploration capability. So to answer the question of why did something happen requires separate analysis using other tools. In the worst case, you may have to rely on database analysts to pull the data for you or perform the analysis for you, taking days to find the answer and be able to react.
- There is no personalization. Some managers and executives might be better served with a slightly customized version of the dashboard that defaults to just their region or department's data.
- Spreadsheets can become corrupted. If you're lucky you have an old backup, but you're wasting time re-updating it. And dashboard delivery is delayed, yet again.
- You can't access them whenever, wherever you want. Real dashboard software requires just a browser and an Internet connection, and you can even pull your dashboard on an iPad or iPhone.
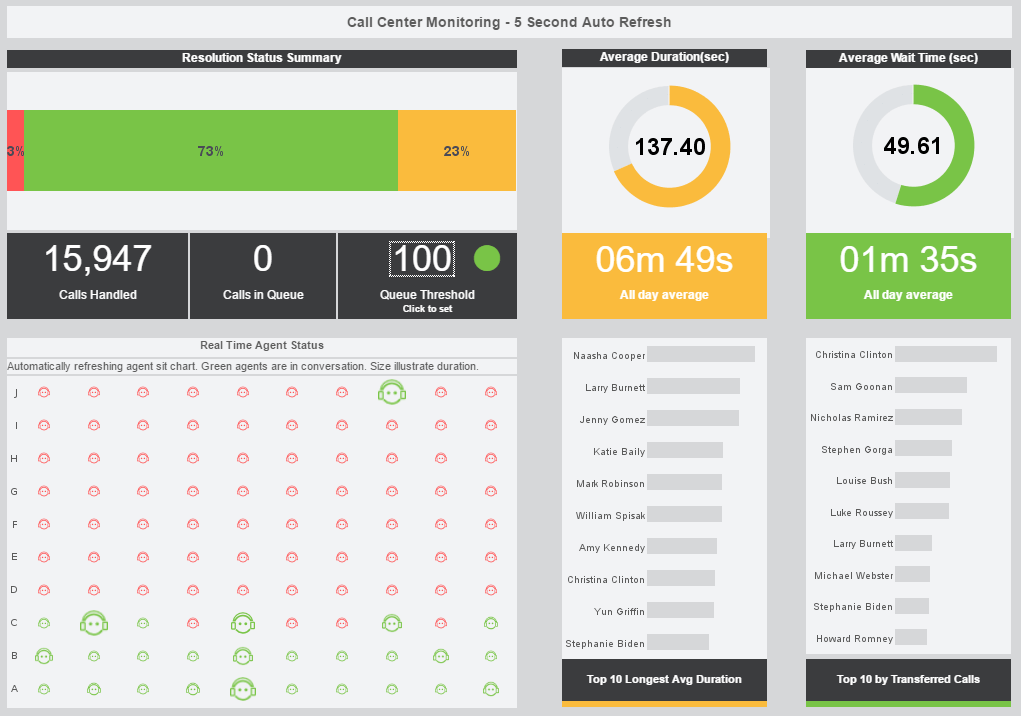
- There are no automated alerts. Real dashboard software can send email alerts based on triggers like an unusual drop in performance.
The Top 3 Reasons to Evaluate InetSoft for Your Dashboard Software
- It's affordable. The software licensing costs for small installations start at around US10,000. If you save 1/4 or and 1/8 of full-time employee's time, this investment pays for itself in a year.
- It's easy to deploy. You don't need a BI consultant to set it up or be a BI expert to run it. Any IT staffer with knowledge of the company databases can handle it.
- It's easy to use. Any business user can use a pre-built dashboard's intuitive point-and-click controls. And power users can build new dashboards in minutes or hours.
What Are the Top Ten Reasons StyleBI Is Better Than Excel?
- Real-Time Data Connectivity: Unlike Excel, which often relies on static imports, StyleBI connects directly to live data sources (databases, APIs, cloud apps), ensuring your dashboards and reports are always up to date.
- Interactive Dashboards: StyleBI offers interactive visualizations—filtering, drill-downs, dynamic charts—that make it easier to explore data intuitively. Excel requires workarounds or macros for similar interactivity.
- Multi-Source Data Mashups: With its schema-less mashup engine, StyleBI can blend disparate data sources (cloud + on-premise, SQL + flat files) into a unified view without manual prep. Excel struggles when integrating complex or large datasets.
- Scalability: Excel slows down with large data volumes or complex calculations. StyleBI is built for enterprise-level scalability, handling thousands of users and millions of rows without performance degradation.
- Collaborative and Web-Based: StyleBI is web-native and supports real-time collaboration, user-based access controls, and versioning. Excel is desktop-centric and lacks seamless, secure multi-user collaboration without add-ons.
- Built-In Multi-Tenancy: For SaaS vendors or organizations supporting multiple departments or clients, StyleBI offers native multi-tenant architecture. Excel requires manual data separation and security workarounds.
- Automated Scheduling and Alerts: StyleBI enables automated report delivery, scheduled dashboard refreshes, and conditional alerts based on data thresholds—none of which Excel does natively.
- Embeddability: StyleBI supports white-label embedding in web apps and portals, with full API access. Excel isn’t designed for embedded BI and offers limited control over visual integration.
- Data Governance and Security: Role-based access control, row-level security, and audit logs are baked into StyleBI’s platform. Excel relies on file-level permissions and lacks enterprise-grade governance.
- No Manual Errors: Excel is error-prone, especially with manual data entry and formula dependencies. StyleBI centralizes logic and uses validated data pipelines, reducing the risk of costly mistakes.
We will help you get started
Contact us