Reporting Software Demo
InetSoft offers its users a powerful tool with its StyleBI platform. StyleBI is capable of innovative dashboard reporting, data mashup, interactive reporting, and visual analysis. It empowers decision makers.
Data management is fast and secure, allowing users to quickly adapt to any situation. The application is more than capable of handling simultaneous data sources. Its users can create new reports and dashboards or modify existing ones.
Utilizing data mashup capabilities, disparate data sets can be modified and manipulated to reveal new insight not initially perceptible.
Web-based drag-and-drop professional authoring tools facilitate the creation of visually sophisticated content with wide sharing capabilities. This allows users to paint a real-time integrated picture of their organization that can be shared with minimal effort, forming optimized caches of data across interconnected networks.
Get a Personalized Demo
Scheduling a personalized demo of InetSoft’s reporting software is the best way to see how powerful and intuitive business intelligence can be. Instead of navigating generic tutorials, a live demo gives you a guided, interactive walkthrough tailored to your organization’s goals, whether that’s financial reporting, operational dashboards, or embedded analytics. The product team will demonstrate how the software connects to your existing data sources—on-premise or cloud—and how its schema-less mashup engine lets you prepare and visualize data without the heavy ETL process.
You’ll get to see how easily you can build dashboards, drill-down reports, and KPI scorecards with a drag-and-drop interface. The demo also shows how multi-tenant setups, role-based access, and embedded OEM deployment work in real scenarios. Whether you're a SaaS provider, enterprise team, or department manager, you'll walk away with a clear understanding of how InetSoft can serve your reporting needs now and scale with you as you grow. Best of all, you’ll have the chance to ask technical or strategic questions specific to your environment—so it’s more than a product tour, it’s a conversation about your reporting future.
Explore InetSoft's Gallery of Live Interactive Reporting Dashboards
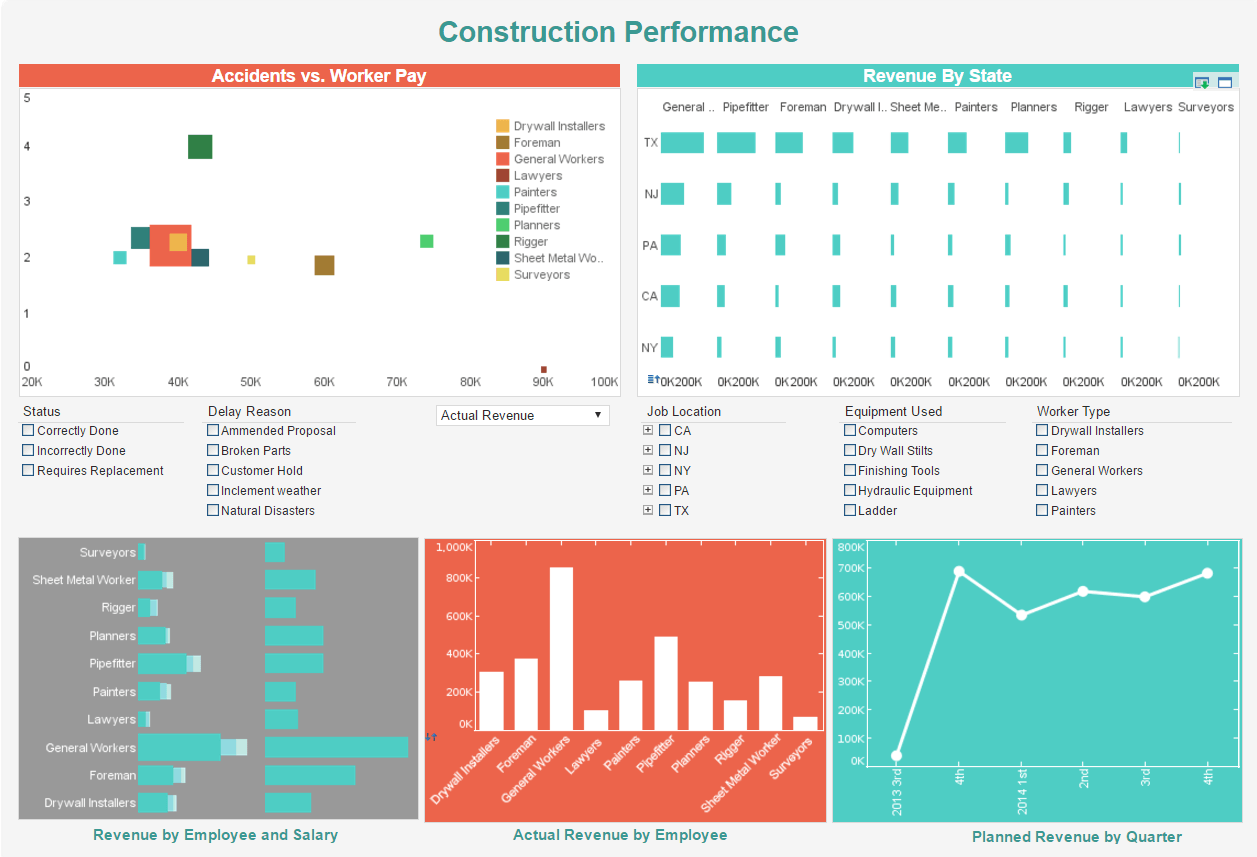
InetSoft’s gallery of live interactive reporting dashboards gives you hands-on access to real-world examples of data visualization at its best. These dashboards aren’t static screenshots—they’re fully functional, responsive, and allow you to interact with filters, drill-downs, and data mashups just as you would in your own environment. Whether you're in operations, finance, sales, or healthcare, the gallery demonstrates how InetSoft’s flexible platform adapts to industry-specific KPIs and workflows.
By exploring these live examples, you'll gain a deeper understanding of how data from different sources can be blended and visualized in one cohesive interface. You’ll see how features like conditional formatting, dynamic parameters, and role-based views are implemented in practical scenarios. This experience helps spark ideas for your own reporting strategy and accelerates your ability to design dashboards that communicate insights effectively. It's also a useful resource to evaluate performance, usability, and mobile responsiveness in action. Whether you're comparing vendors or seeking design inspiration, the gallery showcases the full potential of InetSoft’s analytics engine—proving that professional reporting doesn’t have to be complicated or code-heavy. Dive in and see what’s possible with modern BI.
More Resources About Reporting
-
Quick Intro to StyleBI Mashup
A 2‑minute intro demo showcases how InetSoft’s data mashup powers visual analytics and pixel‑perfect reporting. It demonstrates how easy it is to get started with live dashboards and intelligent visuals. The demo highlights key features like drag‑and‑drop design and automated report scheduling. -
Secure Dashboard Software In Action
This article presents a dashboard software demo showing InetSoft’s secure interactive dashboards and analytics. It illustrates the platform’s ability to empower self-service reporting across organizations. You get a sense of scalability, governance, and end‑user friendliness all in action. -
Vendor Dashboard Demo Examples
Features a vendor-focused demo of analytical dashboards ready for business use. The article includes interactive examples to try firsthand. It emphasises quick deployment and intuitive use for executives and IT alike. -
Big Data Demo Walkthrough
A six‑minute demo shows how StyleBI handles big data sources seamlessly. You’ll see real‑time mashup of big data with other systems and spreadsheet‑like report design. The interface supports what‑if analysis and fast visuals at scale. -
Executive Reporting Dashboard Preview
An executive dashboard demo illustrates hosted or self‑hosted SaaS deployment scenarios. It demonstrates intuitive use by senior managers without reliance on IT. Includes expert onboarding support to accelerate setup. -
Visual Analysis Webcast Demo
A webcast transcript walks through a demo of interactive visual analysis using scatter plots and heat maps. It reveals how to quickly build dashboards and uncover data insights without IT. The session shows a real‑world use case with profitability and operational metrics. -
Industry Interactive BI Demos
A collection of industry‑specific interactive dashboard demos that let you experience real examples. It includes overviews and in‑depth walkthroughs of key BI scenarios. Great for seeing platform capabilities in context. -
Reporting Software Demo Access
A demo page that highlights rapid drag‑and‑drop development of production and ad‑hoc reports. It underscores user‑rated benefits and real examples of management, monitoring, and executive reports. Offers downloadable trial access and live dashboard previews. -
Report Designer Interactive Preview
This article introduces a live demo of the built‑in report designer and dashboard gallery. You can see real dashboards and test interactive components like filters and drill‑downs. Good for evaluating usability of design and visual composition tools. -
Customized Web Dashboard Demo
A web‑based dashboard demo that is personalized to your organization’s objectives and challenges. You get a guided walkthrough tailored to your goals, plus free technical assistance. Ideal for assessing how custom dashboards would look and perform in your environment.

