Dashboard Wallboarding: What It Is And How It Is Used
Dashboard wallboarding is the practice of displaying live dashboards on large, always‑visible screens placed in shared work environments. These screens, often mounted on walls or positioned in high‑traffic areas, continuously show real‑time metrics, alerts, and operational indicators. The purpose is to make critical information impossible to miss, ensuring that teams stay aligned, aware, and ready to act without needing to open a laptop or navigate to a reporting tool.
Wallboards differ from standard dashboards in both intent and design. A typical dashboard is meant for individual exploration, filtering, and analysis. A wallboard is meant for passive viewing. It must communicate quickly, clearly, and at a distance. This means larger typography, simplified visuals, minimal interaction, and a focus on the most essential metrics. A wallboard is not a place for deep analysis. It is a place for instant situational awareness.

Organizations use wallboards to reinforce priorities, highlight performance, and surface issues the moment they occur. When a metric crosses a threshold, when a queue grows too long, or when a system goes down, the wallboard becomes the shared source of truth that everyone can see. This visibility creates accountability and encourages faster responses.
Dashboard wallboarding is the practice of displaying live dashboards on large, always‑visible screens placed in shared work environments. These screens, often mounted on walls or positioned in high‑traffic areas, continuously show real‑time metrics, alerts, and operational indicators. The purpose is to make critical information impossible to miss, ensuring that teams stay aligned, aware, and ready to act without needing to open a laptop or navigate to a reporting tool.
Wallboards differ from standard dashboards in both intent and design. A typical dashboard is meant for individual exploration, filtering, and analysis. A wallboard is meant for passive viewing. It must communicate quickly, clearly, and at a distance. This means larger typography, simplified visuals, minimal interaction, and a focus on the most essential metrics. A wallboard is not a place for deep analysis. It is a place for instant situational awareness.
Organizations use wallboards to reinforce priorities, highlight performance, and surface issues the moment they occur. When a metric crosses a threshold, when a queue grows too long, or when a system goes down, the wallboard becomes the shared source of truth that everyone can see. This visibility creates accountability and encourages faster responses.
Why Wallboarding Matters
Wallboarding matters because it changes how teams behave. When information is visible to everyone, it becomes part of the environment rather than something hidden in a report. Teams naturally start to monitor performance more closely, discuss issues more openly, and collaborate more quickly. The wallboard becomes a silent participant in daily operations, constantly reminding people of what is happening right now.
Another reason wallboarding is valuable is that it reduces friction. Instead of requiring individuals to check a dashboard or wait for a report, the information is already there. This is especially important in fast‑moving environments where seconds matter. A warehouse team can see order backlogs rising. A support team can see call queues spiking. A manufacturing team can see machine downtime increasing. The wallboard eliminates the delay between a change in data and awareness of that change.
Wallboards also help reinforce cultural alignment. When a company wants to emphasize safety, quality, speed, customer satisfaction, or any other priority, the wallboard becomes a constant reminder. It keeps the organization focused on what matters most and ensures that everyone sees the same information at the same time.

Key Characteristics Of Effective Wallboards
Effective wallboards share several common characteristics. First, they are simple. They avoid clutter, unnecessary decoration, and complex interactions. Every element on the screen must earn its place. Second, they are readable from a distance. This means large fonts, high contrast, and clear color semantics. Third, they update frequently. A wallboard that shows stale data loses credibility and becomes ignored. Fourth, they highlight exceptions. A good wallboard makes it obvious when something needs attention.
Another important characteristic is automation. Wallboards should not require manual refreshing or manual data entry. They should pull from live systems, update automatically, and remain accurate without human intervention. This ensures that the information is always trustworthy.
Finally, wallboards must be durable. They run for long periods, often 24/7, so they must be designed to avoid screen burn‑in, handle long‑running sessions, and remain stable even when network conditions fluctuate.
Examples Of Wallboarding Usage
Wallboarding is used across many industries, each with its own priorities and operational rhythms. Below are several examples that illustrate how different teams rely on wallboards to stay informed and responsive.
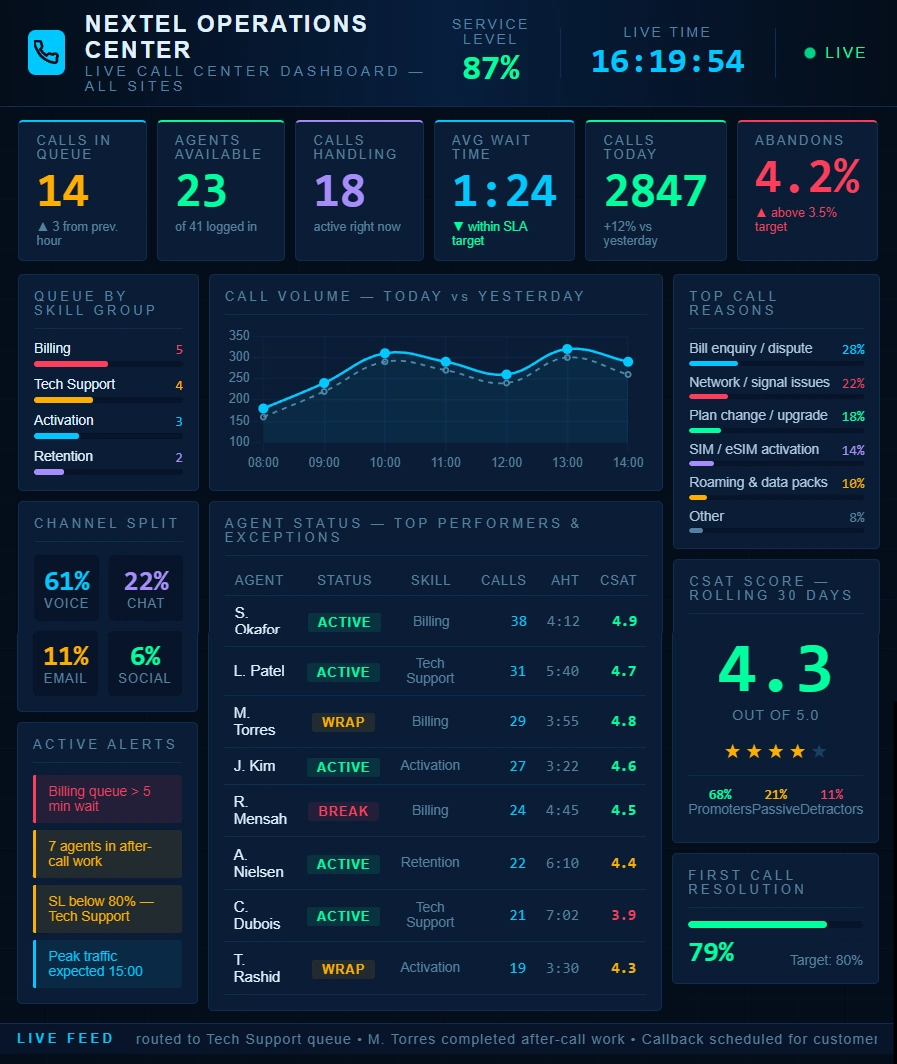
Call Centers And Support Teams
Call centers are one of the most common environments for wallboards. A support wallboard might show the number of calls waiting, average handle time, service‑level performance, agent availability, and escalation alerts. When queues spike, the entire team sees it immediately. Supervisors can reassign staff, agents can adjust their pace, and everyone stays aware of the current load. Wallboards in this environment help maintain service levels and reduce customer wait times.
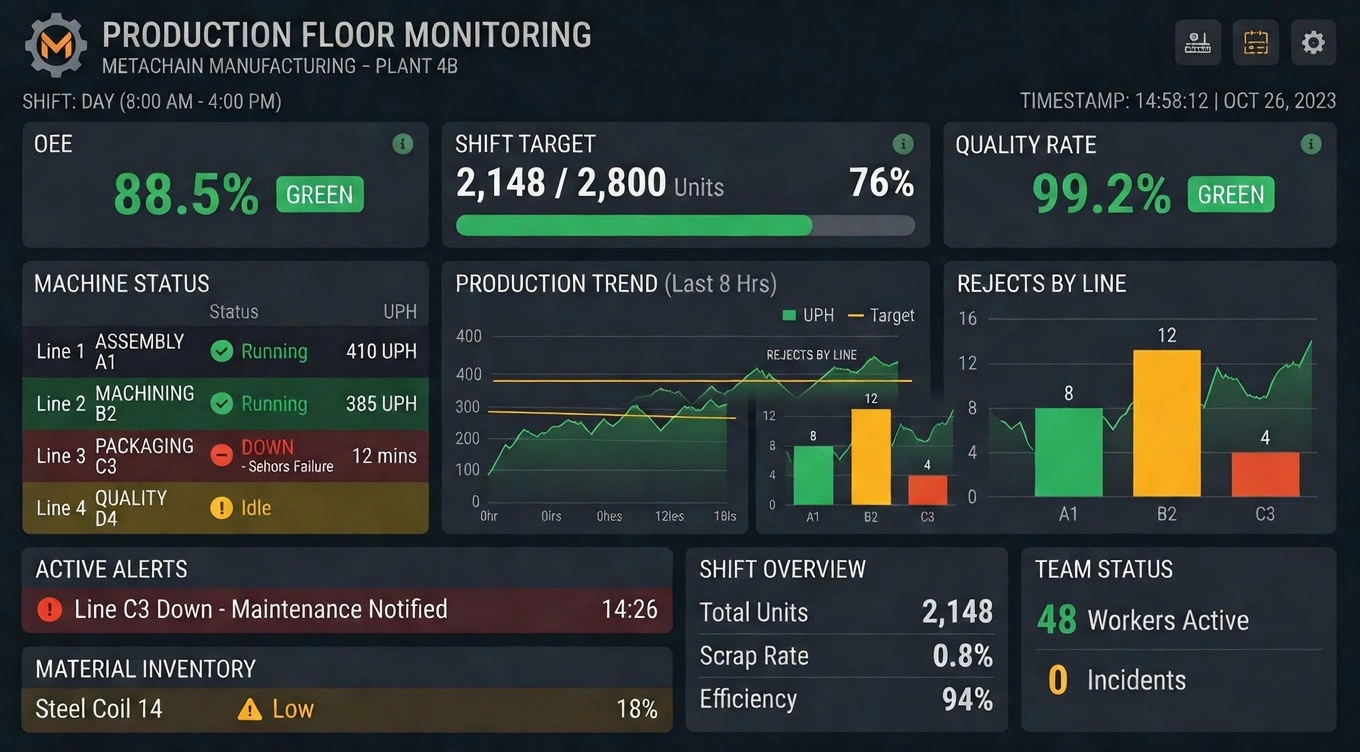
Manufacturing And Production Floors
On a production floor, wallboards often display machine status, throughput, downtime, scrap rates, and safety indicators. Operators can see whether equipment is running smoothly or if a bottleneck is forming. Maintenance teams can see when a machine requires attention. Safety metrics can be displayed prominently to reinforce compliance and reduce incidents. The wallboard becomes a real‑time operational command center for the entire floor.
Warehousing And Logistics
Warehouses use wallboards to track order picking progress, shipping deadlines, inbound deliveries, and inventory exceptions. When a backlog forms, the wallboard makes it visible. When a truck arrives early or late, the team sees it. When inventory levels fall below thresholds, the wallboard highlights it. This visibility helps teams stay ahead of issues and maintain smooth operations.
Sales And Revenue Teams
Sales organizations use wallboards to display pipeline metrics, closed deals, quota progress, and leaderboards. This creates a sense of momentum and friendly competition. It also keeps the team focused on targets and highlights areas where additional effort is needed. When a major deal closes, the wallboard can celebrate it visually, reinforcing motivation and team energy.
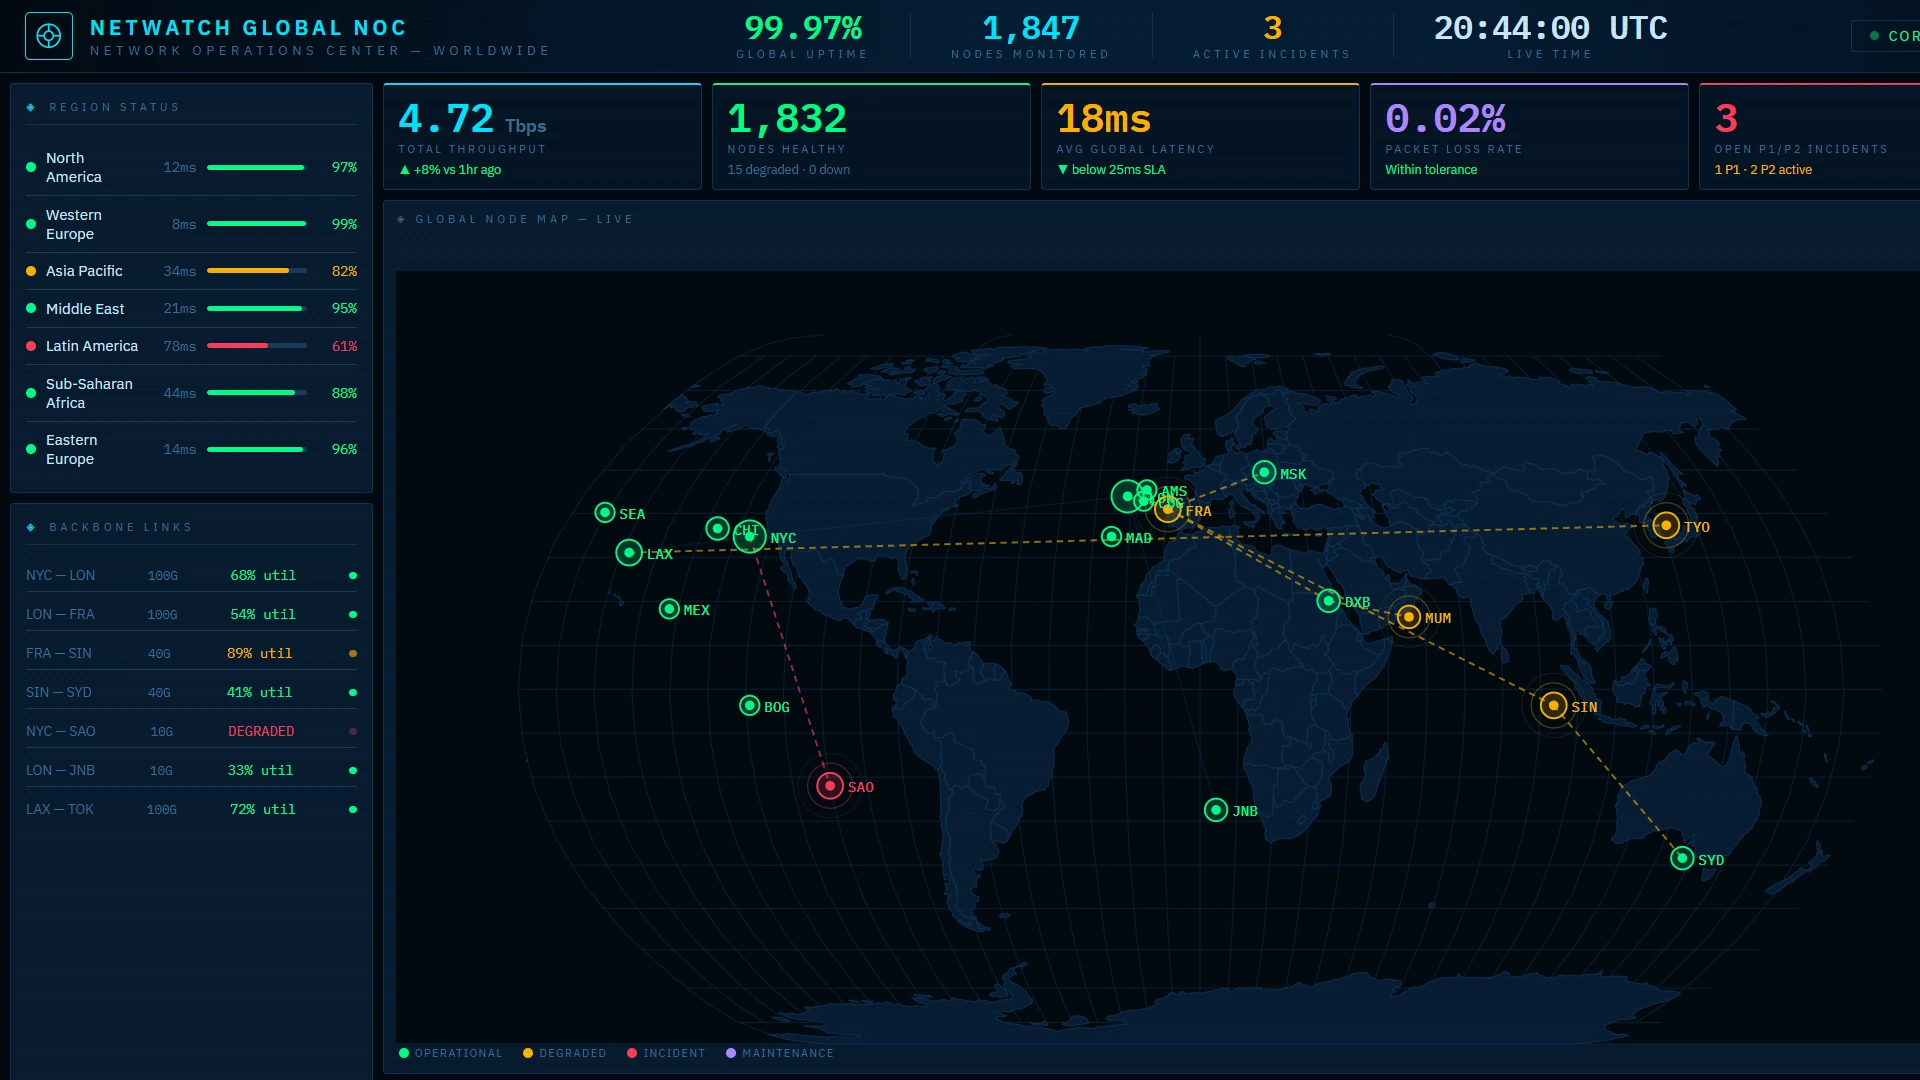
IT Operations And Network Monitoring
IT teams rely on wallboards to monitor system uptime, incident queues, server performance, and security alerts. When a system goes down, the wallboard makes it immediately obvious. When an incident backlog grows, the team sees it. This helps reduce response times and ensures that critical issues are addressed quickly. Wallboards in IT environments often integrate with monitoring tools to provide a consolidated view of system health.
Healthcare And Hospital Operations
Hospitals use wallboards to track patient flow, bed availability, wait times, and staffing levels. Emergency departments, in particular, benefit from real‑time visibility into patient load and triage status. Wallboards help coordinate care, reduce bottlenecks, and improve patient outcomes by ensuring that staff always know the current situation.
Retail And Customer‑Facing Environments
Retail stores use wallboards to display sales performance, foot traffic, staffing levels, and inventory alerts. This helps managers make quick decisions about staffing, promotions, and customer service. In some cases, wallboards are also used in back rooms to show online order fulfillment progress or curbside pickup readiness.

Design Considerations For Wallboards
Designing a wallboard requires a different mindset than designing a standard dashboard. The first consideration is distance. Viewers may be several feet away, so text must be large and legible. The second consideration is attention. People will not stare at the wallboard continuously. They will glance at it. This means the information must be instantly understandable. The third consideration is motion. Subtle animations can help draw attention to changes, but excessive motion becomes distracting.
Color usage is another important factor. Colors must be meaningful and consistent. Red should indicate problems, green should indicate normal conditions, and yellow should indicate caution. Overusing color reduces its impact, so designers must be selective. Similarly, charts must be simple. Bar charts, number tiles, and status indicators work well. Complex visuals like scatter plots or dense tables do not.
Finally, wallboards must be tested in the actual environment where they will be displayed. Lighting conditions, screen size, viewing angles, and ambient noise all influence how effective the wallboard will be. A design that looks good on a laptop may not work well on a large screen across the room.
Shared, Visible, and Actionable Resource
Dashboard wallboarding transforms real‑time data into a shared, visible, and actionable resource. By placing critical information directly in the environment, wallboards help teams stay aligned, respond faster, and maintain focus on what matters most. Whether used in call centers, warehouses, hospitals, or retail stores, wallboards create a culture of transparency and continuous awareness. They are not just screens on a wall. They are operational tools that shape behavior, reinforce priorities, and improve performance across the organization.