What Is SQL Reporting Services Used For?
Relational databases are often managed and worked on using the computer language known as Structured Query Language (SQL). Developers may build and distribute reports that assist users in the analysis and interpretation of data using the toolset known as SQL Reporting Services (SSRS), which is built on top of SQL Server. The definition and applications of SQL Reporting Services will be covered in this article.
What Is SQL Reporting Services (SSRS)?
Users may develop, maintain, and distribute a wide range of reports using SQL Reporting Services (SSRS), a server-based reporting platform. It is a part of Microsoft's SQL Server toolkit and may be used to create reports from a variety of data sources, such as SQL Server, Oracle, and ODBC-compliant databases.
Tables, charts, graphs, and maps are just a few of the many report formatting capabilities offered by SSRS. Reports may also have photos, logos, and other branding components added to them.
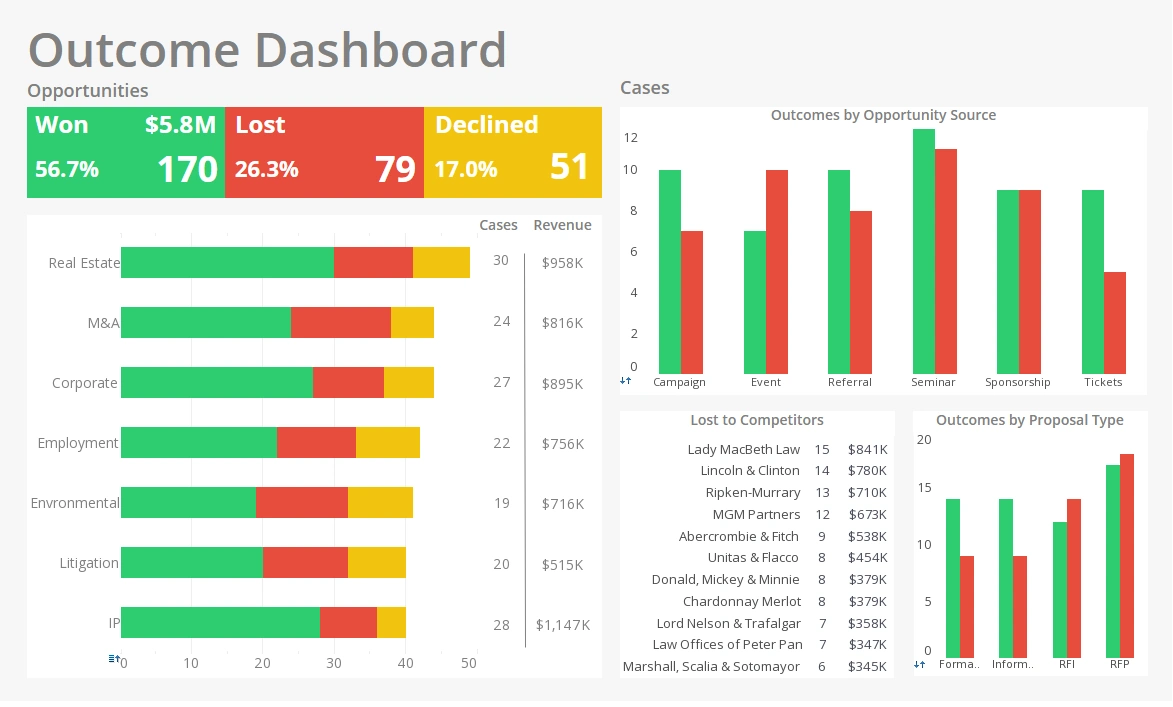

SQL Reporting Services Applications (SSRS)
Producing Operational Reports
Operational reports include thorough details on regular corporate activities, including sales numbers, customer information, and inventory levels. Operational reports may be produced and sent using SSRS to provide current information on how businesses are doing. These reports may be created automatically and sent to interested parties by email or another method.
For instance, a sales team may utilize SSRS to provide reports on their daily sales data broken down by product, area, or salesperson. These reports might be routinely delivered to sales managers or executives, who could utilize them to decide on personnel, product development, and sales strategy.
Making Analysis Reports
By enabling users to examine trends, patterns, and other data in more depth, analytical reports provide users a better degree of understanding into the success of their businesses. SSRS may be used to provide analytical reports that include sales patterns, consumer behavior, and other critical performance factors (KPIs). These reports may be used to make strategic company choices like where to concentrate marketing efforts or which goods to prioritize.
For instance, a marketing team may use SSRS to provide reports on website traffic, conversion rates, and other data that show the success of their marketing activities. These data might be used to pinpoint areas where marketing initiatives should be strengthened, including enhancing landing pages or concentrating on a certain demographic.

Making Interactive Dashboards
Dashboards provide a quick overview of important company indicators and KPIs. Users may dive deeper into data and do ad hoc analysis using interactive dashboards made using SSRS. Web browsers or mobile devices may be used to view these dashboards, which can be tailored to match the demands of various stakeholders.
A company may, for instance, utilize SSRS to build a dashboard that shows important financial information like sales, costs, and profit margins. Users might then dive down into individual areas, such as sales by product or location, to acquire a greater insight of company performance. These dashboards may be viewed by a web portal or mobile application, enabling stakeholders to monitor company performance from any location.
Including Additional Apps in the Integration
Applications like Microsoft Excel, SharePoint, and Dynamics CRM may all be connected using SSRS. This enables users to access and analyze data from inside their favorite apps and create reports that are catered to their particular requirements.
For instance, an accounting team may combine SSRS with their current accounting software to provide reports on accounts due and receivable. This would allow them to analyze financial data and generate reports without having to switch between multiple applications or platforms.
Making Special Reports
Ad hoc reports are those that are created instantly in response to a particular user request. Ad hoc reports may be produced with SSRS, giving customers the ability to query data in real time and produce reports that are tailored to their particular requirements. Many tools, including SQL Server Management Studio and Report Builder, may be used to create these reports.
For instance, a business analyst may create an ad hoc report using SSRS that details regional differences in customer satisfaction levels. They may do a real-time data query and provide a report with insights into client preferences and behavior.

Delivering Reports Automatically
SSRS may be used to automate the distribution of reports, ensuring that stakeholders have the information they want as soon as possible. Reports may be automatically created and sent in accordance with predetermined schedules or in reaction to particular circumstances.
For instance, a finance team may utilize SSRS to create a monthly financial report that is automatically sent to stakeholders on the first of the month. This guarantees that stakeholders have access to the most recent financial data without having to wait for the report to be manually created and delivered.
Which Sectors and Departments Use SQL Reporting Services?
SQL Reporting Services (SSRS) is a popular collection of tools that may be utilized by businesses of all sizes and in a variety of sectors. SSRS is often used in the following contexts:
Accounting and Finance
Financial reports including income statements, balance sheets, and cash flow statements are produced by finance and accounting departments using SSRS. The procedures for financial reporting may be streamlined by integrating these reports with current accounting software and tailoring them to the particular requirements of stakeholders.
Marketing and Sales
SSRS is used by sales and marketing teams to provide reports on sales data, customer information, and marketing campaign results. These reports may be used to pinpoint areas where sales and marketing efforts should be strengthened and to make wise choices about sales strategy, product development, and consumer targeting.

Healthcare
Reports on patient data, clinical results, and financial performance are produced by healthcare organizations using SSRS. These reports can be used to identify trends, patterns, and other data insights that can improve patient care and operational efficiency.
Education
Reports on student performance, attendance, and other important indicators are produced by educational institutions using SSRS. These reports may be used to pinpoint areas where student performance might be enhanced and to decide wisely how to allocate resources and plan academic curricula.
Government
Reports on a range of subjects, including budgeting, public safety, and economic growth, are produced by government organizations using SSRS. These reports may be used to offer people and stakeholders with transparent and timely information on government operations and performance.
Manufacturing
Reports on production data, inventory levels, and supply chain performance are produced by manufacturing organizations using SSRS. These reports may be used to identify areas where manufacturing procedures might be improved and to inform choices regarding supplier relationships and inventory management.

Retail
Reports on sales, inventory levels, and customer information are produced by retail firms using SSRS. These reports may be used to spot trends and patterns in consumer behavior and to make wise choices regarding product offers, marketing tactics, and customer targeting.
Nonprofit
Reports on fundraising, donor information, and program performance are produced by nonprofit organizations using SSRS. These reports may be used to pinpoint areas where fundraising efforts should be strengthened and to help decision-makers allocate resources and invest in programs in the most effective ways possible.
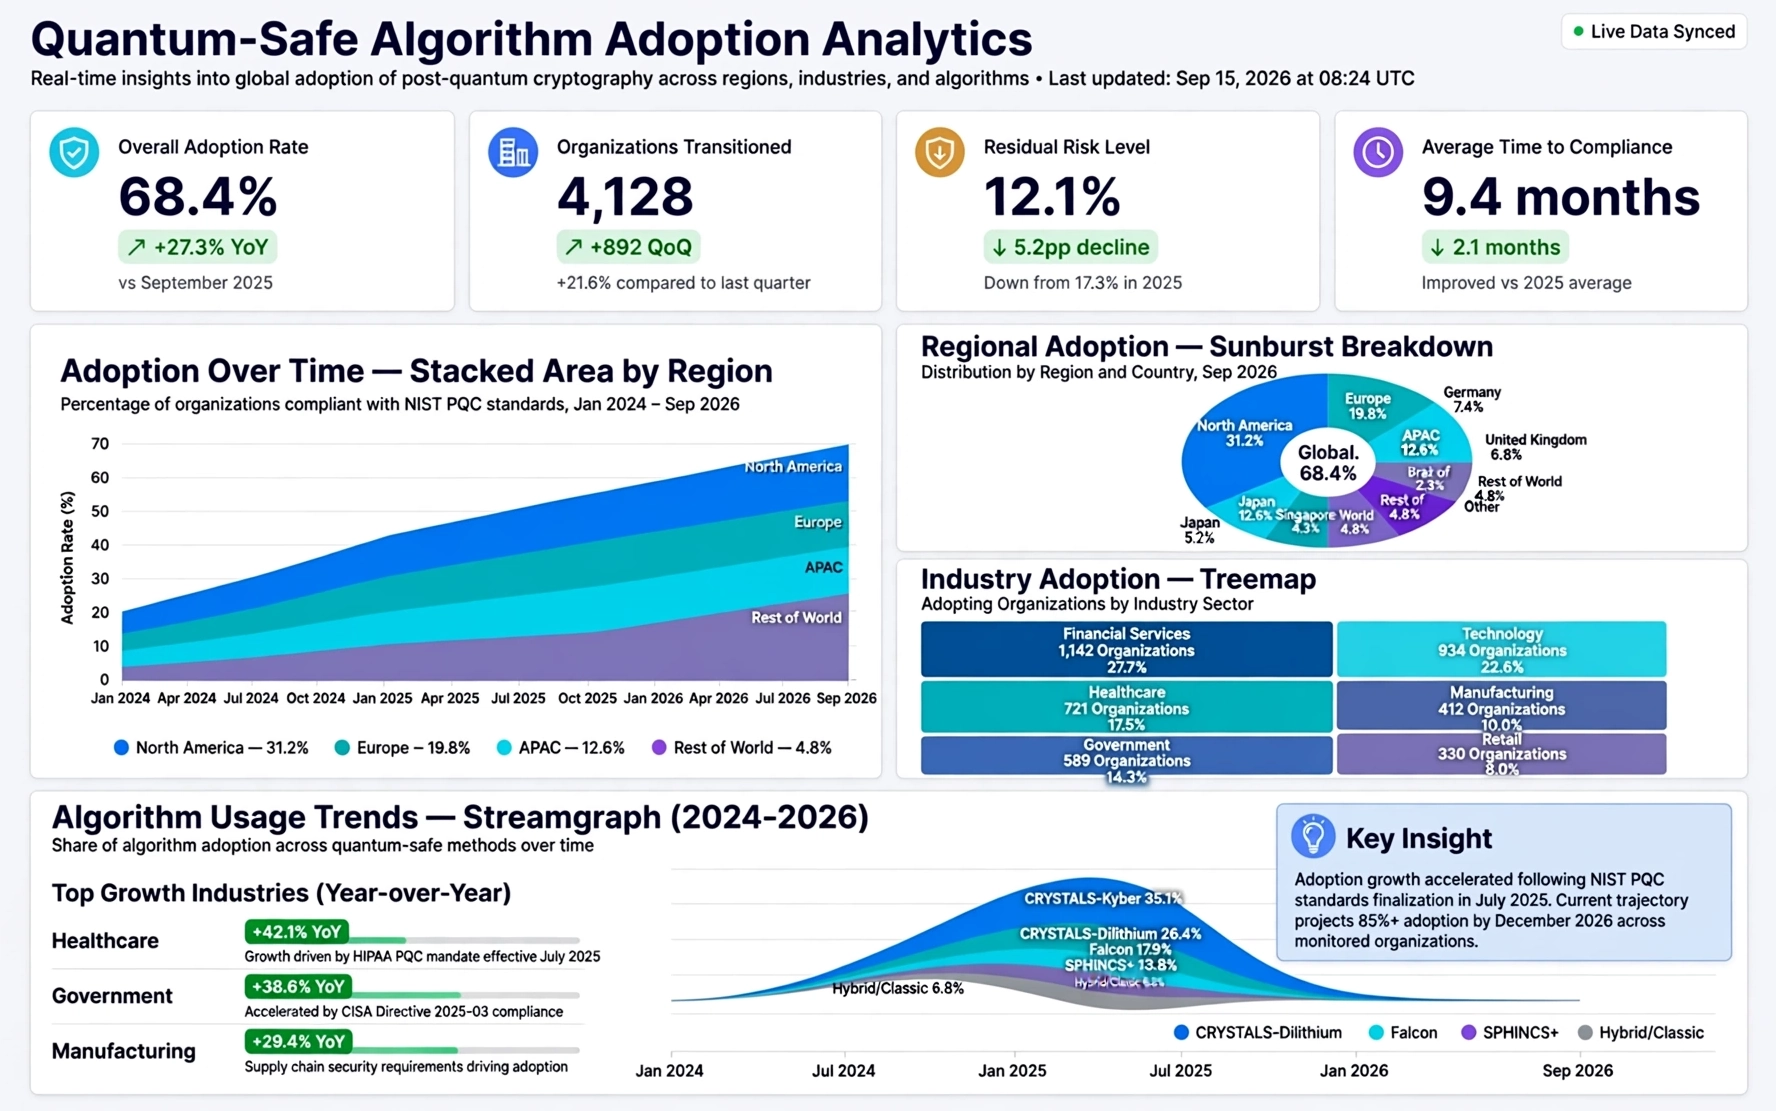
Quantum-Safe Cryptography Hardware Company Migrates From SQL Server Reporting Services To StyleBI
Quantum-Safe Hardware Company Background
QSecure Hardware Systems is a mid-sized manufacturer of quantum-safe cryptography hardware. Its product line includes secure key management appliances, quantum-resistant hardware security modules, and network devices designed to protect long-lived sensitive data against future quantum attacks. Customers include financial institutions, government agencies, and cloud service providers that must comply with emerging post-quantum cryptography standards and maintain strict audit trails for every cryptographic operation.
As the company expanded, its reporting needs grew more complex. Engineering teams needed detailed telemetry from devices in the field, operations teams required manufacturing quality dashboards, and compliance officers demanded granular audit reports for regulators. QSecure initially relied on SQL Server Reporting Services (SSRS) to generate static reports from its SQL Server databases, but the limitations of that stack became increasingly visible as the business moved toward real-time analytics and crypto-agile architectures.
Limitations Of SQL Server Reporting Services
SSRS served QSecure reasonably well in the early stages, when the reporting environment was limited to scheduled PDFs and internal dashboards viewed by a small group of analysts. However, as the company deployed more quantum-safe hardware and expanded into multiple regions, the reporting platform struggled to keep pace. Each new regulatory requirement or customer-specific report meant additional development effort, manual deployment steps, and complex version management.
The core limitations fell into several categories. First, SSRS reports were largely static and page-based, making it difficult for users to explore data interactively. Security engineers wanted to drill into device logs, filter by algorithm suite, and correlate events across time windows, but the report designs were optimized for printing rather than exploration. Second, the platform required specialized skills: report developers had to maintain RDL files, manage Visual Studio projects, and coordinate deployments with IT, which slowed down response to new analytics needs.
Third, SSRS was tightly coupled to the Microsoft stack and on-premise infrastructure. QSecure’s roadmap included hybrid deployments, with telemetry landing in cloud data warehouses and manufacturing data stored in multiple relational systems. Integrating these sources into SSRS required custom ETL pipelines and additional maintenance. Finally, the company wanted to expose selected dashboards to customers through a secure portal, but SSRS offered limited options for modern, embedded analytics experiences.

Why StyleBI Fit The Quantum-Safe Roadmap
QSecure’s architecture team evaluated several business intelligence platforms and selected StyleBI as the strategic replacement for SSRS. The decision was driven by a combination of technical capabilities and deployment flexibility. StyleBI’s browser-based, zero-client design aligned with QSecure’s security posture: users could access dashboards securely without installing desktop software, and administrators could centralize governance and updates.
From a data perspective, StyleBI’s ability to connect to multiple sources—SQL Server, cloud databases, log repositories, and manufacturing systems—allowed QSecure to build unified views of its quantum-safe hardware lifecycle. Engineers could combine device telemetry with support tickets and firmware release data, while compliance teams could blend audit logs with customer contract metadata. This data mashup capability was difficult to achieve with SSRS without extensive ETL work.
StyleBI also provided interactive dashboards and visual analytics features that matched QSecure’s need for exploratory analysis. Security analysts could filter by cryptographic algorithm, hardware model, firmware version, and customer segment in real time. Operations managers could monitor production yield, failure rates, and shipment timelines through intuitive visualizations. Role-based security and row-level access controls ensured that sensitive customer data remained properly segmented across internal and external audiences.

Migration Strategy From SQL Server Reporting Services To StyleBI
The migration from SSRS to StyleBI was planned as a phased program to minimize disruption. QSecure began by inventorying its existing SSRS reports and categorizing them into operational dashboards, regulatory reports, and customer-facing summaries. Many legacy reports were consolidated, as StyleBI’s interactive capabilities allowed multiple views to be combined into a single dashboard with filters and drill-downs.
The data team then defined a semantic layer within StyleBI, mapping key entities such as devices, keys, algorithms, customers, and manufacturing batches. This layer provided a consistent vocabulary for all dashboards and reduced duplication of logic. Existing SQL queries from SSRS were reused where appropriate, but many were simplified or replaced with StyleBI’s visual query and data modeling tools.
During the migration, QSecure prioritized high-value use cases. The first wave focused on security telemetry dashboards, giving engineers a real-time view of quantum-safe algorithm adoption, firmware upgrade progress, and anomaly detection signals. The second wave addressed compliance reporting, replacing static SSRS exports with interactive dashboards that still supported scheduled PDF and Excel delivery for regulators. The final wave introduced customer-facing portals, where selected StyleBI dashboards were embedded into QSecure’s support site with single sign-on and strict access controls.
Training was a critical part of the program. Report developers and analysts were trained to use StyleBI’s designer, while business users learned how to personalize views, save filters, and create ad hoc analyses without relying on IT. Governance policies were updated to define who could publish dashboards, how data sources were approved, and how changes were tracked for audit purposes.
Operational And Strategic Outcomes
After completing the migration, QSecure saw measurable improvements in both operational efficiency and strategic insight. Report development cycles shortened significantly: new dashboards could be prototyped in days instead of weeks, and minor changes no longer required full deployment cycles. The centralized StyleBI environment reduced maintenance overhead compared to managing multiple SSRS instances and associated Visual Studio projects.
Security teams gained deeper visibility into quantum-safe adoption across the installed base. They could track which customers had enabled specific post-quantum algorithms, identify devices running outdated firmware, and correlate cryptographic events with network conditions. This visibility supported proactive outreach and helped QSecure position itself as a trusted partner in quantum-safe migration programs.
Compliance officers benefited from more robust audit trails. StyleBI dashboards exposed detailed event histories, key lifecycle information, and configuration changes in a way that was easier to explain to regulators. Scheduled exports ensured that formal reporting obligations were met, while interactive views allowed internal teams to investigate anomalies quickly.
On the customer side, embedded StyleBI dashboards improved transparency. Clients could log into the portal and see their own device status, algorithm usage, and firmware rollout progress. This reduced the volume of ad hoc reporting requests and strengthened QSecure’s value proposition as a quantum-safe hardware provider with modern analytics capabilities.

Future Roadmap For Analytics And Quantum-Safe Security
With StyleBI in place, QSecure is extending its analytics roadmap. The company plans to integrate additional data sources, including cloud-based key management logs and external threat intelligence feeds, to build richer views of quantum-safe risk. StyleBI’s ability to scale across in-cloud and on-premise deployments aligns with QSecure’s hybrid infrastructure strategy.
The company is also exploring advanced analytics, using StyleBI as the presentation layer for machine learning models that predict hardware failure, estimate cryptographic risk exposure, and recommend firmware upgrade priorities. By combining these models with interactive dashboards, QSecure aims to give customers actionable guidance on how to maintain quantum-safe posture over time.
Ultimately, the migration from SQL Server Reporting Services to StyleBI has become a cornerstone of QSecure’s quantum-safe strategy. The new platform supports crypto-agile reporting, multi-source analytics, and customer-facing transparency, all while reducing operational friction. For a company operating at the frontier of quantum-safe cryptography hardware, modernizing the business intelligence stack was not just a convenience—it was a strategic necessity.