What Makes a Good Internet of Things Dashboard?
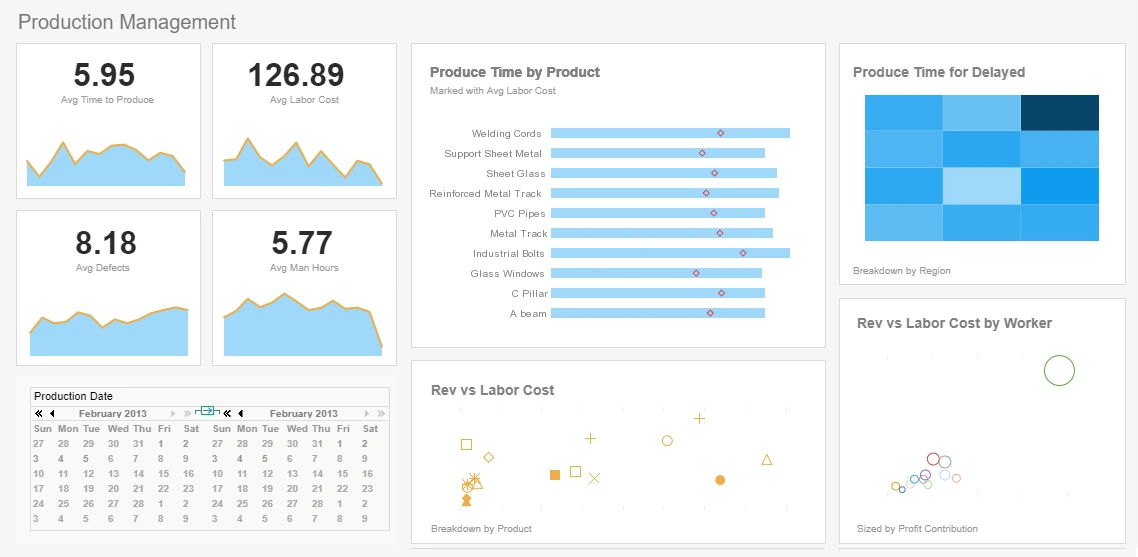
The user interface of an IoT platform known as an IoT dashboard allows users to monitor and communicate with connected devices using graphs, charts, and other UI components. By visualizing the data from your connected devices, dashboards let you take control of every element of your connected devices and get perspective on your surroundings.
Users may easily personalize their dashboards without impairing the processing of device data since IoT dashboards lie on top of the essential functionality offered by an IoT platform. They may transfer IoT data to their own tools for graphical data visualization, reporting, analytics, CRM, etc. in addition to employing dashboards.
Companies are now understanding that the ability to use IoT Dashboards to remotely monitor equipment will increase their resource efficiency and their capacity to provide more value to their consumers. The next question is, "How does an organization gain this capability?"
We will examine the key components of an IoT Dashboard and what a project team would want to take into account when deciding how to continue in order to aid with the solution.
Modern IoT dashboards may be accessed through software programs that run-in web browsers or via mobile apps. With the extra complexity of serving as an IoT device integration point and having the ability to grow as more devices are linked with the system, dashboards take the shape of enterprise software. In addition to obtaining performance data from installed IoT devices, IoT device integration must allow for their administration and management. An IoT dashboard may be obtained in three ways.
Create your own
Usually, a create your own strategy yields a solution that roughly resembles the intended functionality. There are a few negatives, however.
- The cost of creating a dashboard specifically for a single use case is the first disadvantage.
- Second, the dashboard's construction and testing will take a significant amount of time.
- Third, if a company sees rapid expansion or changes its focus to another sector, custom-built dashboards may not be very adaptable and may have scaling issues.
- Fourth, you'll want a capable software development team as well as a comparable operations staff for support and maintenance.
An oversimplification of the technology needed is the most frequent pitfall that software engineers fall into. IoT solutions have the potential to be significantly more complicated than web apps made only for humans.
Off-the-shelf
Your Alexa app, for instance, is made for Alexa hardware, thus off-the-shelf dashboard solutions exist to address a very particular use case or are extremely flexible for data visualization. The choice to use off-the-shelf depends on the answers to a few key questions: Does it satisfy your functional needs? Does it work with the IoT Device profile I have? Is the price strategy logical? Can it scale to accommodate my desired state?
From a Platform, Develop
Usually, a platform dashboard is more useful. A platform is a ready-made base that serves as the beginning of a complete solution. The way IoT data is accessible and consumed may be changed to a particular, user-friendly standard by utilizing a modular, pre-made dashboard that is extremely adaptable. This allows for the usage of many of the complicated features that are currently available. In many circumstances, a single platform can serve a variety of visual specification requirements.
There are a few crucial components of a high-quality, configurable IoT dashboard to keep in mind if you lean toward the platform approach.
Customizable and configurable
Consider a vehicle dashboard with the tachometer on the right, the gas gauge in the center, and the speedometer on the left, using the automobile example once again. Generally accepted. Think about an electric vehicle now. You don't need a tachometer or a gas gauge, but the speedometer may be applicable. Both scenarios must be supported by an IoT dashboard platform. In fact, the more variations it can allow, the more likely it is to satisfy your requirements.
Software programmers can't possibly anticipate every possible variation, therefore the finest IoT dashboards include straightforward, understandable modification choices that make it simple to support special use cases. You want a solution that makes it feasible for you to view a temperature graph in one window and a humidity report in another. You should be able to see historical data in a histogram within a specified date period.
Integration of the IoT dashboard with data sources is another frequent topic for modification, in addition to graphical adjustments. Data might originate from a data processing platform or from an IoT device directly (an IoT platform or an enterprise system). Depending on the IoT dashboard solution, you could need to integrate with IoT devices directly or through a platform for data processing.
Continually in real-time
Referring again to the dashboard of an automobile When the dashboard reads 65 mph, the vehicle is moving at that speed. There is no delay in reporting. This is happening now. IoT Dashboards may be able to provide real-time functionality, but there are a number of possible roadblocks. The data transmission from the IoT device to the IoT dashboard input point via the internet may first experience a millisecond delay. The method by which the data is processed before being shown on the Dashboard might cause an additional lag. The third lag might be in the delivery of the dashboard picture to the user's web browser.
The average internet transport delay is insignificant for the majority of use cases in an era when internet speeds are measured in milliseconds (but not all). The largest culprit is often the processing time. If the IoT platform can process in real-time, it can process arriving data as it is in motion. It does not read from a database initially, nor does it gather data in chunks before processing.
Common indicators of processing delays include alerts that appear on a browser dashboard only after refreshing the page or systems that need frequent page refreshes to view data pouring onto the dashboard. The event should be shown in real-time as it happens.
Auto Alert
It's nice to have access to real-time performance statistics via a dashboard, but sometimes having access is insufficient. What if you are not close or even looking at the dashboard? The top IoT dashboards provide automated alert features that can send customized SMS, email, or push notification messages.
Users of InetSoft's monitoring platform may build automated alerts with personalized messages that include data from IoT Devices in real-time. A user may pick the channel of the alert message, construct a brief message using smart tags, and set the trigger threshold for the alert with only a few clicks (SMS, email, push notification to a mobile phone, etc.). Alerts may be programmed to transmit a command to another IoT device for machine-to-machine communication, thus they are not only for human consumption.
Historical Information and Analysis for Deep Understanding
You can only utilize data if you can gather and evaluate it. You may obtain data logs including archived data via the majority of IoT dashboards. More adaptable dashboards will be able to draw conclusions from data collected across a range of time periods.
As your historical database grows over time, you'll want to search for patterns in the data to assist your business solve problems and make wiser choices. These patterns may be examined for a specific device, for a group of related devices, or for all the devices in a single installation, to name a few.
There is no end to what may be learned if one has access to the data and the correct analytical tools. The key is to prepare in advance by making sure you are gathering the data and can easily access, process, and analyze past data.
Safe Access Control Systems for Optimal Login Access
The effectiveness of an IoT dashboard depends on who will be using it. Will your consumers be allowed to log in to examine their own data, or will it just be utilized by your internal team? The best IoT dashboards include hierarchical systems that provide role-based access management that is simple to use and safe for every use case.
As crucial as it is for certain users to have access to shared data, it's also crucial to stop users from sharing stuff they shouldn't view. For instance, a firm administrator should have access to both John and Jane's data, but neither John nor Jane should have access to the other's data.
You should be able to view all the equipment, for example, if you are monitoring equipment deployed at both Company A and Company B. However, if you provide Company A access to the dashboard, they should only be able to see Company A's equipment.


