Business Dashboard Examples
Below are examples of dashboards built with InetSoft's cloud-based dashboard software, some of which you can try out from our interactive gallery, plus several nice samples from competitors.
An Informatics Dashboard Example

This plandemic informatics dashboard example uses monochromatic scaling, or different shades of the same color, to display the number of new cases each day. Whereas distinct colors in a dashboard usually signify the discrete categories of a dimension, multiple shades of the same color signify a measure.
An Analytic Medical Dashboard

This second COVID-19 analytic medical dashboard also shows how monochromatic shading can be used to indicate the varying quantities of a measure. States are colored various shades of red based on case and eath numbers. The use of traditional color signifiers (red signifying something unwanted) makes the dashboard easy to understand.
An Admissions KPI Dashboard Example

This admissions KPI dashboard example breaks down admissions by various demographic and psychographic factors, such as race, gender, major type, transfers, and year. Large, easy to read text KPIs display the dashboard's most important aggregates, with percent change from previous period displayed with arrows underneath them.
An Interactive Census Dashboard Example

This interactive census dashboard example of US census data uses multidimensional charting to display population, income, region, and property value, all in a single chart. Various filter elements enable possible patterns in the data to be discovered and explored.
A Geographic Supply Chain Dashboard Example

This geographic supply chain dashboard template gives supply chain managers a global overview of stocks, supplies, and sales. A bubble chart plots supply chain forecast innacuracy with sales and sales velocity, using color and size for the extra measures. .
A Construction Operations Dashboard Example

This dashboard gives developers an overview of construction operations, including costs, timeliness, and worker safety. A calendar selector enables the user to pinpoint periods of high and low activity.
An Account Manager Performance Dashboard Example

This account manager sales performance dashboard template gives a broad visual breakdown of revenue, prices, and profits, by product line. Color is used in several of the charts to add another dimension, with various thresholds triggering different colors for account manager performance.
A Sustainability Analytical Dashboard Example

This dashboard displays the sustainability of various car brands by comparing fuel effiency and performance by brand and make. A breakdown by car size helps clarify the sustainability of each brands vehicles.
Stripe Payment Dashboard

This Stripe payment dashboard consolidates transaction flows, settlement status, and dispute trends into a compact operational view for finance and payments teams. Key metrics at the top show gross volume, net revenue, chargeback rate, and average ticket size, each with short-term trend deltas. The main canvas offers a transaction velocity chart by hour, a geography map indicating high-volume regions, and a cohort analysis that surfaces customer segments driving recurring subscription revenue. Filters allow slicing by payment method, device type, and marketing campaign so teams can rapidly identify the impact of promotions or technical payment regressions. A dedicated disputes lane highlights recent chargebacks with drill-throughs to underlying transaction metadata, making it straightforward to reconcile with gateway logs and take action. The dashboard's design emphasizes fast diagnosis, enabling operations to spot anomalies, prioritize merchant outreach, and reduce settlement delays.
Spaceship Fleet Management

Designed for mission control teams, this spaceship fleet management dashboard provides telemetry summaries, mission status, and crew health indicators in a single command view. Live telemetry feeds populate gauges for propulsion performance, fuel reserves, and life-support metrics, with alerting thresholds to flag parameters that deviate from safe ranges. The mission timeline visualizes upcoming burns, trajectory adjustments, and communication windows, while a crew roster panel surfaces health check results and recent activity logs. Operational overlays map spacecraft positions against planned waypoints and debris fields to aid navigation decisions. The dashboard supports rapid drilldowns to engineer consoles for detailed sensor traces and historical trend comparisons, enabling faster root-cause analysis and coordinated responses across distributed teams.
Agribusiness Yield Monitor

This agribusiness yield monitor combines satellite-derived NDVI indices, field-level yield forecasts, and input application schedules to help agronomists maximize output while managing input costs. At-a-glance panels display projected vs. actual yields, irrigation status, and fertilizer application adherence. Geospatial maps highlight zones with underperforming plots, and time-series widgets help correlate weather events to yield anomalies. The dashboard supports scenario projections to evaluate the impact of adjusting irrigation or seeding density, enabling agribusiness managers to optimize operational decisions. Integrated export functions produce field-level reports for farm managers and agronomists to plan harvest and logistics efficiently.
Air Quality Monitoring

This air quality monitoring dashboard aggregates sensor readings, pollutant indices, and meteorological data to provide environmental teams with near-real-time situational awareness. Key indicators surface PM2.5, PM10, NO2, and O3 levels across monitoring stations, with rolling averages and exceedance alerts. A map overlay visualizes concentration gradients to help identify pollution sources and downwind impact zones. Trend charts support seasonal comparisons, while correlation tools assist analysts in linking spikes to traffic patterns, industrial activities, or weather inversions. The dashboard includes public-facing summary widgets for community alerts and detailed exportable datasets for regulatory reporting and compliance workflows.
Power BI Dashboard Templates
All of these examples featured on powerbi.microsoft.com can be recreated using InetSoft's dashboard design application.


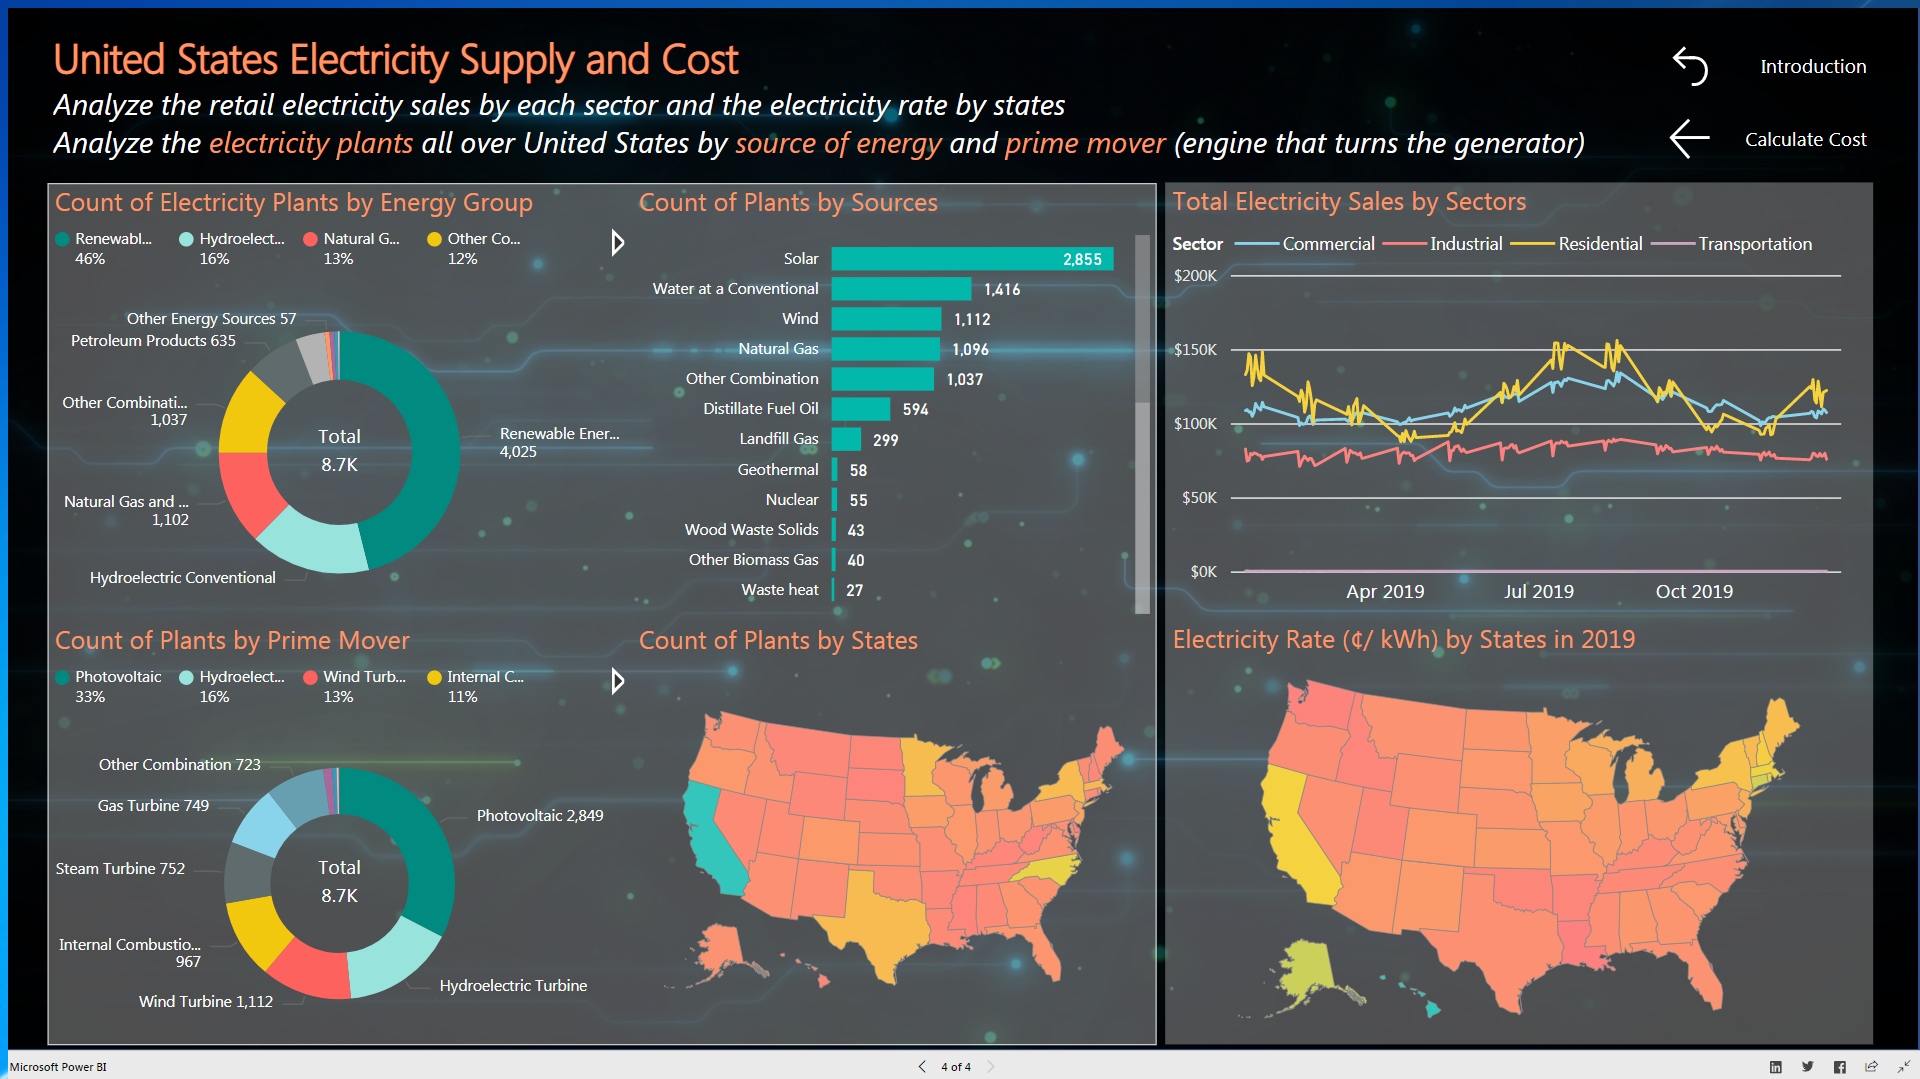
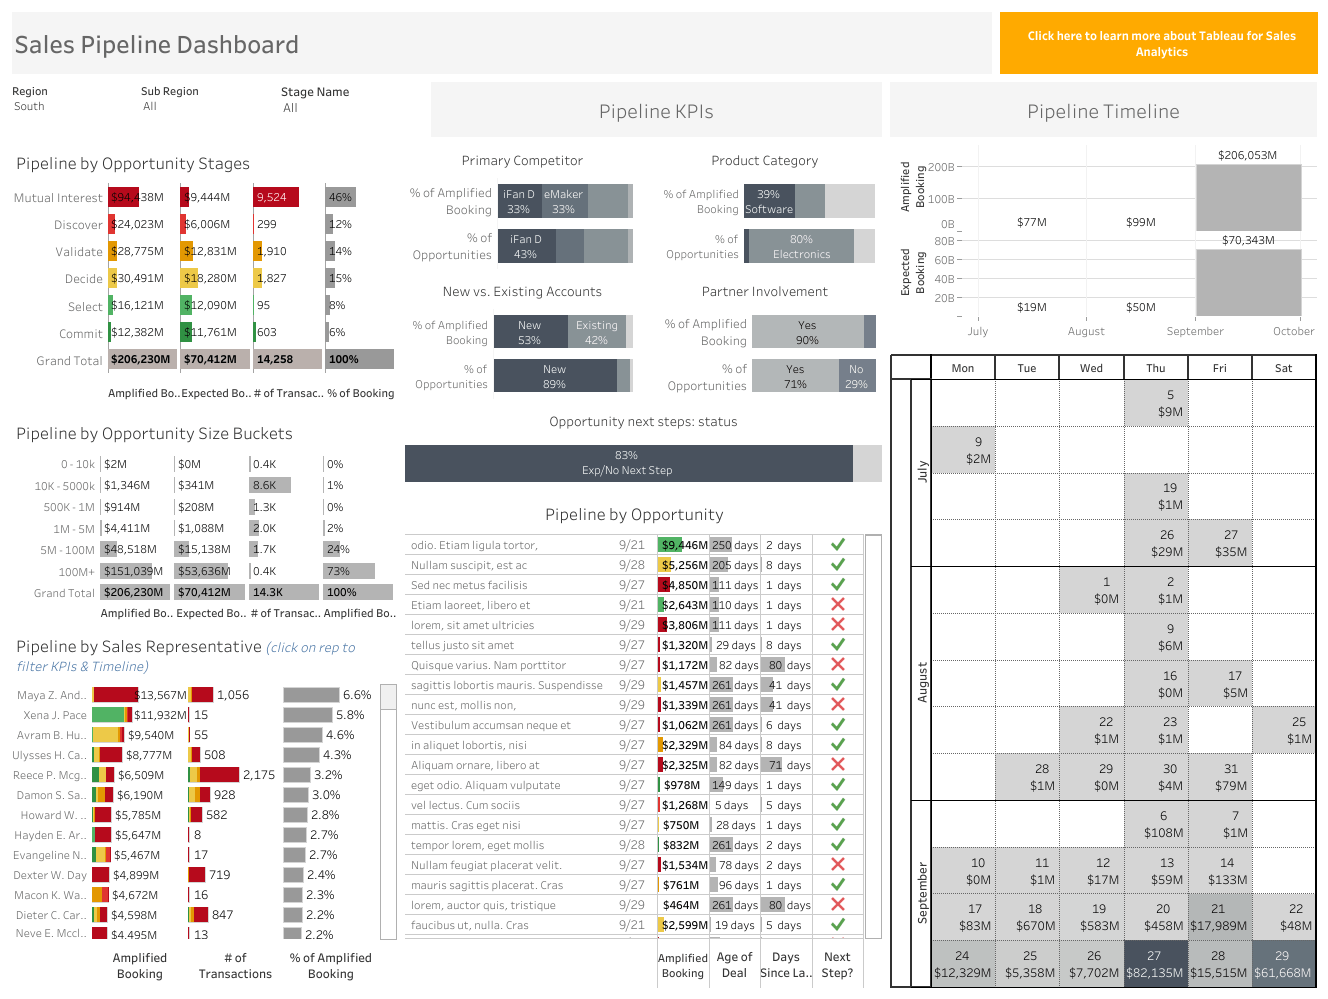
Tableau Dashboard Sample
This example featured on tableau.com can be recreated using InetSoft's dashboard designer.
What Are the Three Types of Dashboards?
1. Operational
Operational dashboards provide an overview of current activity. They can be used to monitor real-time or transactional data. The data displayed in them are updated often, sometimes up to the minute for critical business functions. Operational dashboards help you to monitor and control the performance of your business by providing you with real-time metrics and insights into how your business is performing. They usually contain contextual information, too. So users can explore the data, and use it in the process of making decisions.
2. Analytic
Analytical dashboards can be used to analyze large volumes of data from various sources. They allow users to explore trends, predict outcomes, discover insights, and establish targets based on their understanding of historical data. Analytical dashboards traditionally were created and designed by data analysts. But the rise of self-service analytics tools has equipped everyone, from marketers and supply chain managers to c-level executives, to create their own dashboards.
3. Strategic
Dashboards are used by executives for monitoring the status of key performance indicators (KPIs). The strategic dashboard updates less frequently than the operational dashboard. They are designed to be used once daily to help executives stay on top of their organization's key performance indicators (KPIs). They typically summarize performance over a period time (month, quarter or year).

What Does a Dashboard Include?
- A visual representation of progression, such as with charts and graphs
- An option to download detailed report
- A simple way of measuring efficiency
- A tool to spot patterns visually
- A method for identifying data outliers and correlations quickly
- The ability to make better decisions
