Business Intelligence Developer Unveils a Green Car Dashboard
InetSoft designs an interactive application that allows users to discover the most eco-friendly consumer vehicles
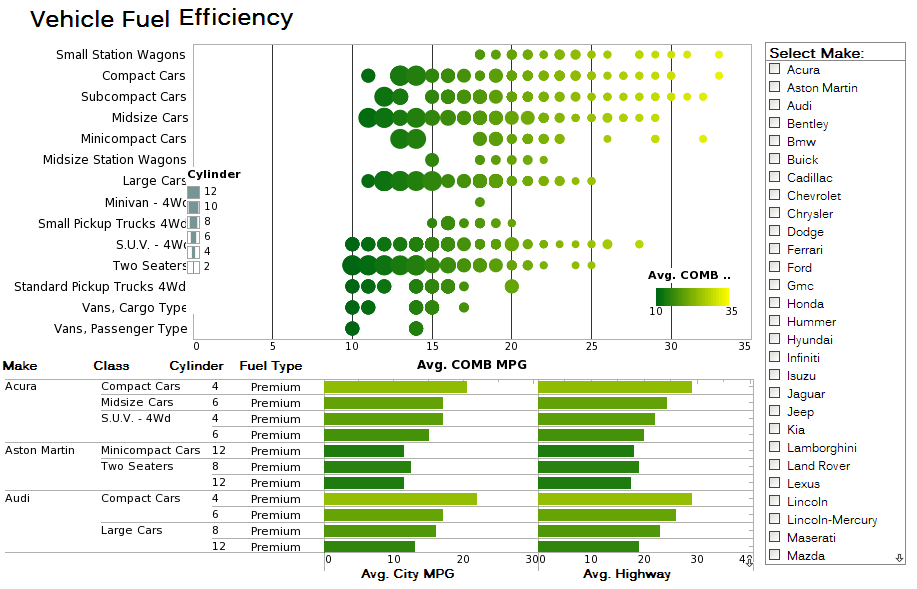
Piscataway, NJ - February 15, 2011 - InetSoft Technology (www.inetsoft.com), an innovator in dashboard, reporting and data mashup solutions, unveiled a free interactive dashboard that allows users to discover the most eco-friendly consumer vehicles for model years 2009 through 2011. The browser-based application can be accessed at: http://www.inetsoft.com/info/green_car_dashboard/ and will allow users to jump right in with simple intuitive tools that allow for quick visual analysis.
Drawing on public information provided by the Environmental Protection Agency (EPA), the dashboard allows users to instantly sort through thousands of lines of information by checking off category boxes and using range sliders to single out desirable vehicle attributes. Charts and graphs make it easy to spot outliers, and more in depth information can be found by clicking on neighboring tabs. Compared to searching through hundreds of competing car manufacturer and information websites, this visual analysis tool promises to save a great deal of time and effort.
“This simple tool demonstrates the powerful capabilities found in our agile business intelligence software,” said Mark Flaherty, Chief Marketing Officer at InetSoft. “Conscientious consumers will have a powerful resource that will allow them to analyze large swaths of data quickly and easily while making faster and better informed decisions.”
The Green Car Dashboard has been deployed using Visualize Free, a free visual analysis tool based on the advanced commercial dashboard and visualization software developed by InetSoft. Visualize Free permits anyone to upload and sift through multi-dimensional data to spot trends and aberrations or slice and dice data with simple point-and-click methods, and gives users the option to share their visual analysis with others or keep it private. To try Visualize Free, please visit www.visualizefree.com.
About InetSoft
Since 1996 InetSoft has been delivering easy, agile, and robust business intelligence software that makes it possible for organizations and solution providers of all sizes to deploy or embed full-featured business intelligence solutions. Application highlights include visually-compelling and interactive dashboards that ensure greater end-user adoption plus pixel-perfect report generation, scheduling, and bursting. InetSoft’s patent pending Data Block™ technology enables productive reuse of queries and a unique capability for end-user defined data mashup. This capability combined with efficient information access enabled by InetSoft’s visual analysis technologies allows maximum self-service that benefits the average business user, the IT administrator, and the developer. InetSoft solutions have been deployed at over 3,000 organizations worldwide, including 25% of Fortune 500 companies, spanning all types of industries. For more information, media and analysts may contact:
Contact
For more information, media and analysts may contact:
Mark Flaherty
InetSoft Technology Corp.
+1.732.424.0400 x 936
mark.flaherty@inetsoft.com
www.inetsoft.com
Quotable
“This simple tool demonstrates the powerful capabilities found in our agile business intelligence software.”
Visualization Examples
