Baan (Infor) Dashboard Reports
InetSoft has an easily customized BI solution for the Baan (Infor) ERP platform. Dashboards and reports can be created very quickly that will increase visibility into process performance metrics and a reduce manual labor associated with information gathering and presentation.
Self-service at all levels of an organization is fully-enabled. With minimal set up required from IT, power users can create their own views of the data and mash it up with other relevant data sources. Non-technical business users can have highly personalizable interactive analytical dashboards.
You don't have to settle for manual massaging of data and creation of reports which risk data accuracy and waste time and effort. StyleBI connects to your live Baan data and includes a drag and drop designer for creating whatever dashboard or scorecard you wish.


Upgrade Dashboards and Reports
While Baan is good for managing the processes within your organization, information access and presentation is not its strong point. Would you like to increase the level of interactivity or the visual appeal of information display by taking advantage of modern dashboard and reporting technologies? Would you like to reduce hours of weekly effort that is currently spent on exporting data into office suites for manipulation and charting?
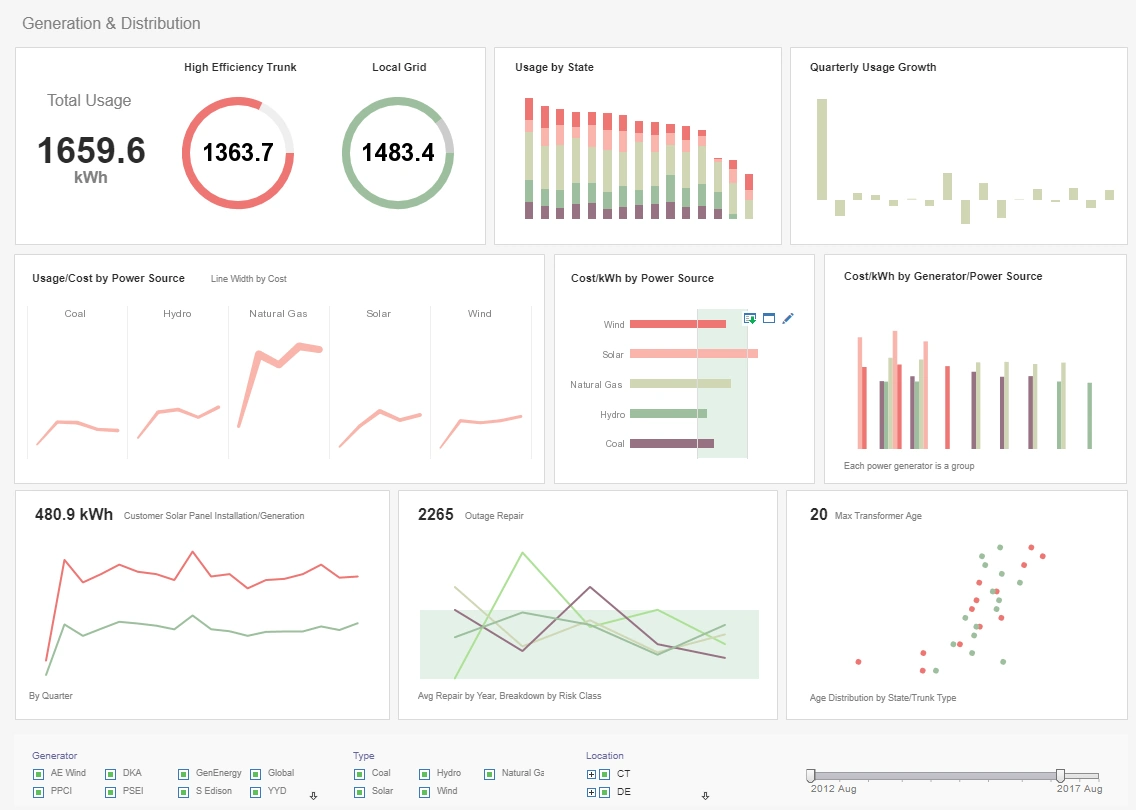
StyleBI is a small-footprint Java-based business intelligence server that enables rapid development and deployment of monitoring and analytical dashboards such as this:
Create Data Mashups of Baan and Other Enterprise Data
A key differentiator of InetSoft's business intelligence software is support for data mashups. You can combine data from your Baan application with almost any other data source you have in your organization such as: relational databases (JDBC), multidimensional databases, XML, SOAP, Java beans (POJO), EJB beans, spreadsheets, flat files, OLAP cubes, PeopleSoft, JD Edwards, Siebel CRM, and more.
InetSoft offers unique capabilities in the area of data mashup. Business end-users can create their own mashups with whatever data you expose to them combining different data sources that have not been previously modeled for them. It also possible for users to bring in their own data sets such as those in local spreadsheets or those provided by external partners and then share the dashboards or reports based on them, inside the corporate BI environment.
What Are the Drawbacks to Infor Dashboards?
Here are some common drawbacks to consider:
-
Complexity of Implementation: Implementing Infor Dashboards can be complex, especially for organizations with diverse data sources, complex data models, or specific integration requirements. Configuring data connections, designing dashboards, and setting up security permissions may require specialized skills and expertise.
-
Limited Customization Options: While Infor Dashboards offer some degree of customization, the range of available visualizations, layout options, and customization capabilities may be limited compared to other dashboarding tools. Users may find it challenging to create highly tailored dashboards that meet their specific needs and preferences.
-
Dependency on Infor Ecosystem: Infor Dashboards are typically part of the broader Infor ecosystem, which includes enterprise resource planning (ERP), customer relationship management (CRM), and other business applications. Users who are not fully invested in the Infor ecosystem may find it challenging to integrate Infor Dashboards with their existing systems or leverage third-party data sources.
-
Performance and Scalability Issues: Large-scale deployments or implementations with extensive data volumes may experience performance issues or scalability challenges. Infor Dashboards may struggle to handle real-time data updates, complex calculations, or high concurrency levels, leading to latency or system slowdowns.
-
Limited Data Connectivity: While Infor Dashboards support integration with various data sources such as relational databases, OLAP cubes, and web services, users may encounter limitations in terms of supported data formats, protocols, or connectivity options. Integration with certain proprietary or legacy systems may require custom development or middleware solutions.
-
User Interface and User Experience (UI/UX): Some users may find the user interface of Infor Dashboards less intuitive or user-friendly compared to other dashboarding tools. The design and navigation may not align with modern UI/UX trends, leading to challenges in adoption and usability for non-technical users.
-
Cost of Ownership: The cost of licensing, implementation, and ongoing support for Infor Dashboards can be significant, especially for small or mid-sized organizations with limited IT budgets. Users should carefully evaluate the total cost of ownership and return on investment (ROI) when considering the adoption of Infor Dashboards.
-
Limited Support for Advanced Analytics: While Infor Dashboards offer basic data visualization and reporting capabilities, they may lack advanced analytics features such as predictive modeling, machine learning, or natural language processing. Users requiring advanced analytical capabilities may need to supplement Infor Dashboards with additional tools or platforms.
-
Vendor Lock-in: Organizations that heavily rely on Infor Dashboards may face vendor lock-in, as migrating to alternative dashboarding solutions or transitioning away from the Infor ecosystem can be complex and costly. Users should consider the long-term implications of vendor lock-in and evaluate alternative solutions with more flexible migration paths.
-
Security and Compliance Considerations: Ensuring data security, compliance with regulatory requirements, and protection of sensitive information is critical when using Infor Dashboards. Users should carefully configure security settings, access controls, and data encryption mechanisms to mitigate security risks and safeguard confidential data.
More Articles About Dashboard Considerations
Best Practices for Evaluating Enterprise Software - Evaluating enterprise software is a critical process that requires careful consideration of various factors to ensure that the chosen solution aligns with the organization's needs, objectives, and strategic priorities. Here are some best practices for evaluating enterprise software effectively...
Considerations for Query Performance - For performance reasons, you should avoid using too many large queries in one report. In addition, you should only run a query from script in cases where you cannot directly bind the query. In general, it is more efficient to use the 'Data Binding' dialog box to bind the query to an element, which allows the query to automatically run as part of report generation...
Final Area of the Reporting Lifecycle - Now comes distribution, and this is where we will talk about our final area of the reporting lifecycle, and then we will move off into stating a challenge or a couple of challenges. Ensuring that the report is transportable is obviously key in this whole process. It goes without saying. The three main methods of distribution are email, Web hosting and printing...
Lifecycle of a Business Analyst - Speaking specifically to the agenda what I wanted to do was break apart the lifecycle that a business analyst goes through and in my own research and findings I found that a big component of an analyst's time is spent gathering stakeholder requirements. So we are going to talk about what's involved there and where the best practices can be incorporated.