Enterprise Asset Management
Enterprise asset management professionals depend on software such as Aptean's TabWare EAM, IBM's Maximo, Infor, MAPCON, and SAP. However, information access can quickly become challenging once the needs exceed built-in, mostly static reporting capability. The challenge increases when mashing up data from other enterprise sources such as ERP systems becomes necessary.
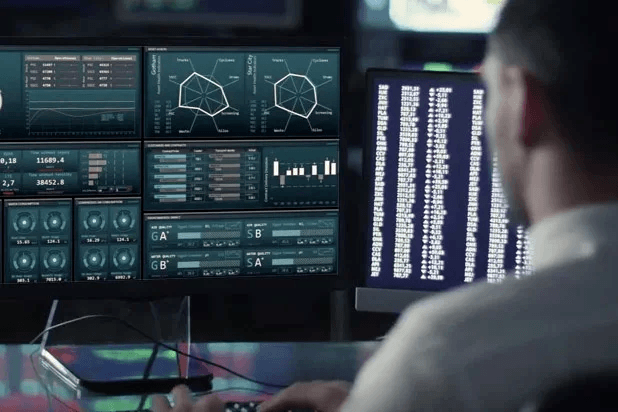
Visual Dashboards for EAM Systems
InetSoft's business intelligence web app creates a common data layer where data mashup is easily accomplished. Within the same web app, data can be quickly turned into visualization dashboards for online analytics and monitoring.
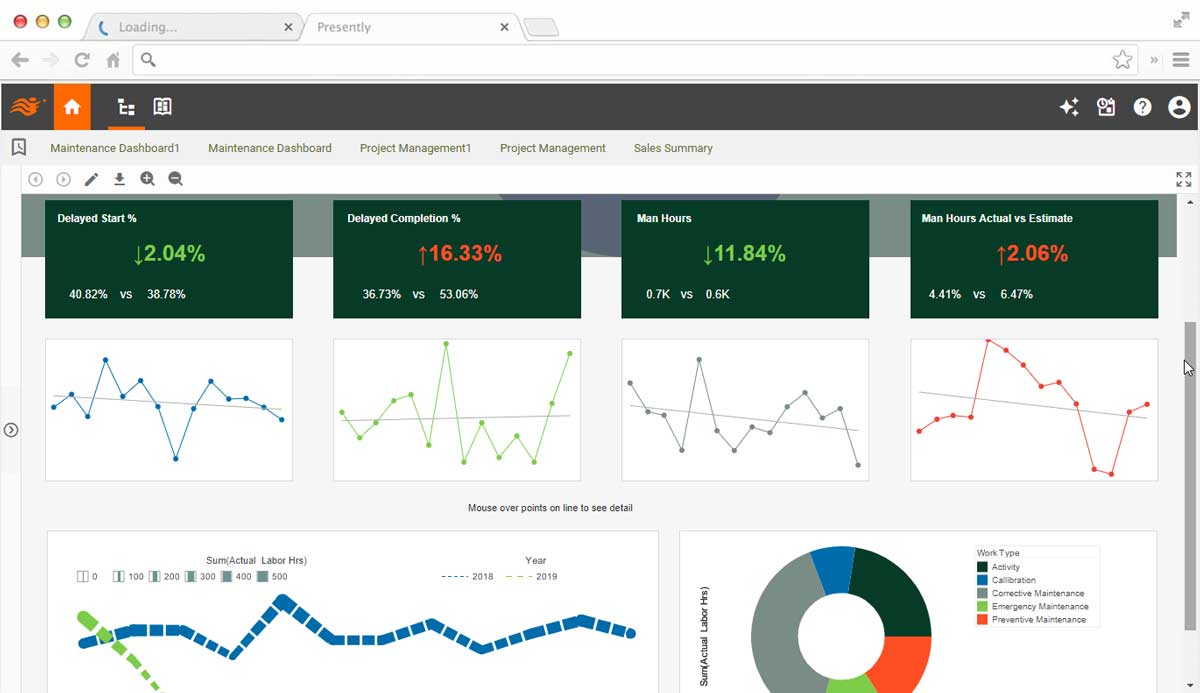
What Are the KPIs and Metrics Tracked in an Enterprise Asset Management Dashboard?
Some common KPIs and metrics tracked in an EAM dashboard include:
-
Asset Utilization: This metric measures the percentage of time that assets are in productive use versus idle or downtime. High asset utilization indicates efficient use of resources, while low utilization may signal underutilized or inefficient assets.
-
Asset Availability: Asset availability measures the percentage of time that assets are available and operational when needed for production or service delivery. High availability indicates reliable asset performance, while low availability may indicate maintenance issues or downtime.
-
Mean Time Between Failures (MTBF): MTBF measures the average time between asset failures or breakdowns. A high MTBF indicates reliable asset performance and minimal downtime, while a low MTBF may indicate frequent breakdowns and maintenance issues.
-
Mean Time to Repair (MTTR): MTTR measures the average time it takes to repair or restore an asset to operational status after a failure or breakdown. A low MTTR indicates efficient maintenance processes and quick resolution of issues, while a high MTTR may indicate inefficiencies in maintenance workflows.
-
Maintenance Costs: This metric tracks the total cost of maintenance activities, including labor, parts, and materials, associated with asset management. Monitoring maintenance costs helps organizations optimize maintenance budgets and identify opportunities to reduce costs without compromising asset performance.
-
Asset Health Index: The asset health index combines multiple indicators, such as equipment condition, performance data, and maintenance history, to assess the overall health and condition of assets. A high asset health index indicates well-maintained assets with minimal risk of failure, while a low index may indicate assets in need of maintenance or replacement.
-
Compliance and Regulatory Requirements: Organizations track compliance with regulatory requirements and industry standards related to asset management, safety, and environmental regulations. Monitoring compliance metrics helps ensure that assets are managed in accordance with legal and regulatory requirements, reducing the risk of penalties and fines.
-
Return on Assets (ROA): ROA measures the financial return generated by assets relative to their cost or value. A high ROA indicates efficient asset utilization and effective asset management practices, while a low ROA may indicate underperforming assets or inefficient resource allocation.
-
Work Order Backlog: Work order backlog tracks the number of pending maintenance tasks or work orders for asset repairs, inspections, or preventive maintenance activities. Monitoring work order backlog helps organizations prioritize maintenance activities and allocate resources effectively to address maintenance needs in a timely manner.
-
Energy Consumption: For assets with energy consumption, tracking energy usage and efficiency metrics helps organizations identify opportunities to reduce energy costs, improve sustainability, and minimize environmental impact through energy-saving initiatives and asset optimization strategies.

What Are the KPIs and Metrics Tracked in an Equipment Maintenance Dashboard?
An equipment maintenance dashboard is designed to monitor the performance and effectiveness of maintenance activities for machinery, equipment, and assets within an organization. Key performance indicators (KPIs) and metrics tracked in an equipment maintenance dashboard typically include:
-
Overall Equipment Effectiveness (OEE): OEE is a comprehensive metric that measures the overall productivity and efficiency of equipment by assessing its availability, performance, and quality. It provides insights into how well equipment is utilized and how effectively it performs compared to its maximum potential.
-
Mean Time Between Failures (MTBF): MTBF measures the average time between equipment failures or breakdowns. A high MTBF indicates reliable equipment performance and longer intervals between failures, while a low MTBF may indicate frequent breakdowns and maintenance issues.
-
Mean Time to Repair (MTTR): MTTR measures the average time it takes to repair or restore equipment to operational status after a failure or breakdown. A low MTTR indicates efficient maintenance processes and quick resolution of issues, while a high MTTR may indicate inefficiencies in maintenance workflows.
-
Planned Maintenance Percentage (PMP): PMP measures the percentage of maintenance activities that are planned and scheduled in advance versus reactive or unplanned maintenance. A higher PMP indicates proactive maintenance practices and better control over maintenance schedules, reducing the likelihood of unexpected downtime.
-
Maintenance Cost per Unit: This metric tracks the total cost of maintenance activities, including labor, parts, and materials, per unit of production or operating hours. Monitoring maintenance cost per unit helps organizations optimize maintenance budgets and identify opportunities to reduce costs without compromising equipment reliability.
-
Equipment Downtime: Equipment downtime measures the total duration of unplanned or planned downtime for equipment maintenance, repairs, and changeovers. Minimizing downtime is critical to maximizing equipment availability and productivity, so tracking downtime metrics helps identify opportunities for improvement.
-
Preventive Maintenance Compliance: Preventive maintenance compliance measures the percentage of scheduled preventive maintenance tasks that are completed on time as planned. Monitoring compliance with preventive maintenance schedules helps ensure that equipment is properly maintained and serviced according to manufacturer recommendations and industry best practices.
-
Work Order Backlog: Work order backlog tracks the number of pending maintenance tasks or work orders for equipment repairs, inspections, or preventive maintenance activities. Monitoring work order backlog helps prioritize maintenance activities and allocate resources effectively to address maintenance needs in a timely manner.
-
Equipment Reliability: Equipment reliability metrics, such as failure rates, mean time to failure (MTTF), and reliability indices (e.g., reliability-centered maintenance), assess the reliability and performance of equipment over time. These metrics help identify trends and patterns in equipment reliability and guide maintenance strategies to improve equipment performance and longevity.
-
Safety Incidents: Safety incidents related to equipment malfunctions or failures, such as accidents, injuries, or near misses, are important indicators of equipment performance and maintenance effectiveness. Tracking safety incidents helps identify potential safety hazards and risks associated with equipment operation and maintenance, allowing organizations to implement preventive measures to enhance workplace safety.