Data Intelligence for Insurance


The data management needs of insurance companies are among the largest, most diverse, and most complex of any major industry. InetSoft's data intelligence platform can serve as the unification solution to disparate and seemingly unwieldy data sources while providing a vantage point from which decision makers can survey the chaotic landscape below.

Business Intelligence for Insurance


Automated parameterized reports keep managers in the know while a robust toolset allows users to weave quantitative analysis, qualitative alerts, and predictive insurance analytics into a seamless process that can effectively increase revenue, control costs, and help to manage risk.

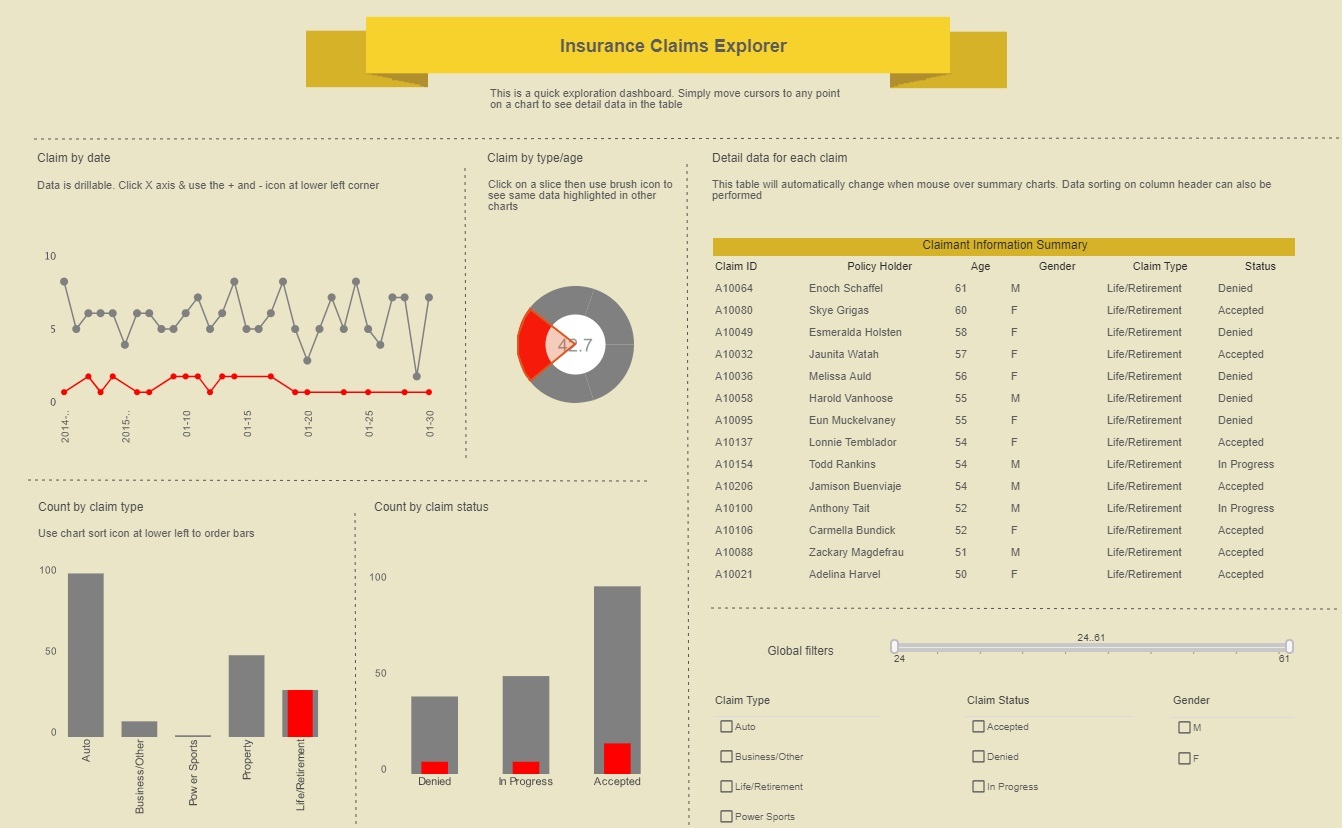
Custom dashboards accentuate metrics that must be improved upon in order to meet minimum standards set for key performance indicators like: number of days claims are open, claims where initial liability decision is not made within statutory time frame, and percentage of claims with missing documentation.

insurance dashboard example

Spotlight on Insurance Industry Applications


A prominent insurance company needs to determine which product lines have the potential to produce the most revenue according to customer segment. In order to do so, they must first analyze who their current customers are and where they are located.

Using InetSoft allows enterprises to swiftly evaluate multi-dimensional data with simple user created visual representations and the flexible pricing structure affords regional offices with the opportunity to view a complete and accurate picture of their customer base and plan accordingly.


insurance dashboard creator web app

Other Business Intelligence Applications for the Insurance Industry

  • Sales and marketing management
  • Pricing of products and serviced
  • Agent performance analysis
  • Fraud detection and prevention
  • Geographic cluster analysis
  • Claims management
  • Compliance with regulations

Some of InetSoft's Customers in Insurance

  • ING North America Insurance Group
  • Canal Insurance Company
  • Great American Insurance Group

What KPIs Are Tracked by an Insurance Claims Processor?

Here are some common KPIs tracked by an insurance claims processor:

  1. Claims Processing Time:
    • Average Processing Time: Measures the average time taken to process a claim from submission to resolution, including initial review, investigation, adjudication, and payment.
    • Cycle Time: Tracks the elapsed time between each stage of the claims processing workflow, identifying bottlenecks and areas for process improvement.
  2. Claims Accuracy and Quality:
    • Claims Accuracy Rate: Calculates the percentage of claims processed accurately without errors, discrepancies, or omissions, ensuring compliance with policy terms, regulatory requirements, and industry standards.
    • Error Rate: Measures the frequency of errors or discrepancies detected during claims processing, including data entry errors, coding errors, and documentation deficiencies.
  3. Claims Turnaround Time:
    • Turnaround Time: Evaluates the speed at which claims are processed and resolved, measuring the time taken to review, approve, deny, or pend claims for further investigation.
    • Time to First Contact: Tracks the time elapsed between receiving a claim and initiating contact with the claimant or policyholder for additional information or clarification.
  4. Claims Backlog and Aging:
    • Backlog Size: Quantifies the number of claims awaiting processing or resolution beyond the target timeframe, indicating the workload and capacity of the claims processing team.
    • Aging Analysis: Segments claims by age categories (e.g., 30 days, 60 days, 90 days+) to assess the distribution of aging claims and prioritize resolution based on urgency.
  5. Claims Cost and Payment Accuracy:
    • Average Claims Cost: Calculates the average amount paid per claim processed, including reimbursements, settlements, and benefits payouts, to monitor claims expenses and trends over time.
    • Payment Accuracy Rate: Measures the percentage of claims processed correctly and paid accurately, minimizing overpayments, underpayments, and payment disputes.
  6. Provider and Member Satisfaction:
    • Provider Satisfaction Scores: Surveys healthcare providers to assess their satisfaction with the claims processing experience, responsiveness, communication, and reimbursement accuracy.
    • Member Satisfaction Scores: Solicits feedback from policyholders or insured members regarding their satisfaction with claims processing, customer service, claims resolution, and payment timeliness.
  7. Claims Denial and Rejection Rates:
    • Denial Rate: Calculates the percentage of claims denied or rejected during the adjudication process, categorizing denials by reason codes (e.g., eligibility, coverage, coding errors).
    • Appeals and Reconsideration Rates: Tracks the frequency of claims appealed or resubmitted for reconsideration following initial denial, measuring the effectiveness of appeals processes and resolution outcomes.
  8. Compliance and Regulatory Metrics:
    • Compliance with Turnaround Time Requirements: Ensures adherence to regulatory deadlines and service level agreements (SLAs) for claims processing, reporting any instances of non-compliance or violations.
    • Audit Findings and Corrective Actions: Monitors audit results, compliance assessments, and regulatory inquiries, implementing corrective actions to address identified deficiencies or compliance gaps.
  9. Fraud Detection and Prevention:
    • Fraudulent Claims Detected: Quantifies the number of potentially fraudulent claims identified through fraud detection algorithms, data analytics, investigations, and referrals to special investigative units (SIUs).
    • Fraud Loss Ratio: Calculates the ratio of fraudulent claims payouts to total claims paid, assessing the effectiveness of fraud prevention measures and mitigation strategies.
  10. Operational Efficiency and Productivity:
    • Claims Processing Cost per Claim: Measures the average cost incurred to process each claim, including labor, overhead, technology, and administrative expenses.
    • Productivity Metrics: Tracks productivity indicators such as claims processed per hour or per FTE (full-time equivalent), assessing the efficiency of claims processing workflows and resource allocation.

Reasons Why Organizations Choose InetSoft


Software Advice BI FrontRunner
G2 Crowd High Performer


"Customer service is the best I've encountered among software vendors. All the technicians are extremely knowledgeable, patient and will make every effort to accommodate your schedule and resolve the issue in a timely manner. "
- Jack P.


"I spent months looking for the best dashboard/reporting app to suit my business. I literally tried and tested every application out there and I have to say that the Style Intelligence App is by far the best. It is simple to use and it is absolutely brilliant if you are needing dashboards on custom objects." - Jacki A.