Learn About Marketing Campaign Metrics
Take the depth and breadth of information assimilated through your marketing campaigns and harness the intuitive agility of InetSoft's robust software available to you as a campaign dashboard.
Going beyond rudimentary marketing practices, InetSoft adds to the value of marketing metrics in executive dashboards with illustrative outliers, identifying other in-depth analytics, and bridging the gap between departmental KPI's. Most companies pride themselves on their data analysis because of the power it has to tap into a market.
Besides being the basis of organizational developmemt, marketing metrics are what takes a company to the next level, provided that they are able to make real-time comparisons to benchmarks in their industry, and quickly pivot.
InetSoft's software takes the hard work out of this process and delivers a more agile, easy and robust software, that promises no better way, time or place to put these tools into practice.

35 Marketing Campaign Metrics
- Impressions: The number of times your ad or content is displayed to potential customers.
- Clicks: The number of times someone clicks on your ad or content.
- Click-through rate (CTR): The percentage of people who click on your ad or content after seeing it.
- Cost-per-click (CPC): The average cost you pay for each click on your ad.
- Cost-per-impression (CPM): The cost you pay for every 1,000 impressions of your ad.
- Cost-per-action (CPA): The cost you pay for each desired action, such as filling out a form or making a purchase.
- Conversion rate: The percentage of people who take a desired action, such as making a purchase or filling out a form, after clicking on your ad or content.
- Return on ad spend (ROAS): The revenue you generate for every dollar spent on advertising.
- Customer lifetime value (CLV): The estimated amount of revenue a customer will generate over their lifetime as a customer.
- Customer acquisition cost (CAC): The cost of acquiring a new customer, including advertising and marketing expenses.
- Net promoter score (NPS): A measure of customer loyalty and satisfaction based on how likely customers are to recommend your brand to others.
- Engagement rate: The percentage of people who interact with your ad or content, such as by liking, commenting, or sharing.
- Social media reach: The number of unique individuals who see your social media posts.
- Social media impressions: The number of times your social media posts are displayed.
- Social media engagement: The number of interactions (likes, comments, shares) your social media posts receive.
- Email open rate: The percentage of people who open your marketing emails.
- Email click-through rate: The percentage of people who click on links within your marketing emails.
- Email conversion rate: The percentage of people who take a desired action, such as making a purchase, after clicking on a link within your marketing emails.
- Landing page conversion rate: The percentage of people who complete a desired action, such as filling out a form or making a purchase, after landing on your website.
- Bounce rate: The percentage of people who leave your website after visiting only one page.
- Time on site: The average amount of time visitors spend on your website.
- Exit rate: The percentage of people who leave your website after visiting multiple pages.
- Search engine ranking: Your website's position in search engine results for specific keywords or phrases.
- Organic traffic: The number of visitors who come to your website from search engines without clicking on an ad.
- Referral traffic: The number of visitors who come to your website from other websites.
- Direct traffic: The number of visitors who come to your website by directly typing your URL into their browser.
- Mobile traffic: The percentage of visitors who access your website on a mobile device.
- Average order value (AOV): The average amount of revenue generated per order.
- Cart abandonment rate: The percentage of visitors who add items to their cart but do not complete the checkout process.
- Social media follower growth: The number of new followers gained on social media platforms.
- Social media engagement growth: The increase in social media engagement compared to a previous time period.
- Customer retention rate: The percentage of customers who continue to purchase from your brand over a period of time.
- Net revenue: The total revenue generated from a marketing campaign minus the total cost of the campaign.
- Brand awareness: The level of recognition and familiarity customers have with your brand.

Bridging The Gap
Sharing visualizations pertinent to stakeholders, executives, project managers, and lower-level employees, all of whom have different performance indicators to measure and tackle, it is more efficient for the end user to digest only information that is necessary to make informed decisions. With the web based platform an evaluation within a moments notice actually leads the discussion and puts your business ahead of your competitors.
Visualizations are known to create a fresh perspective and enchance the outlook of the work flow and are specifically designed to lead the decision making process, it brings your attention to numbers without feeling overwhelmed.
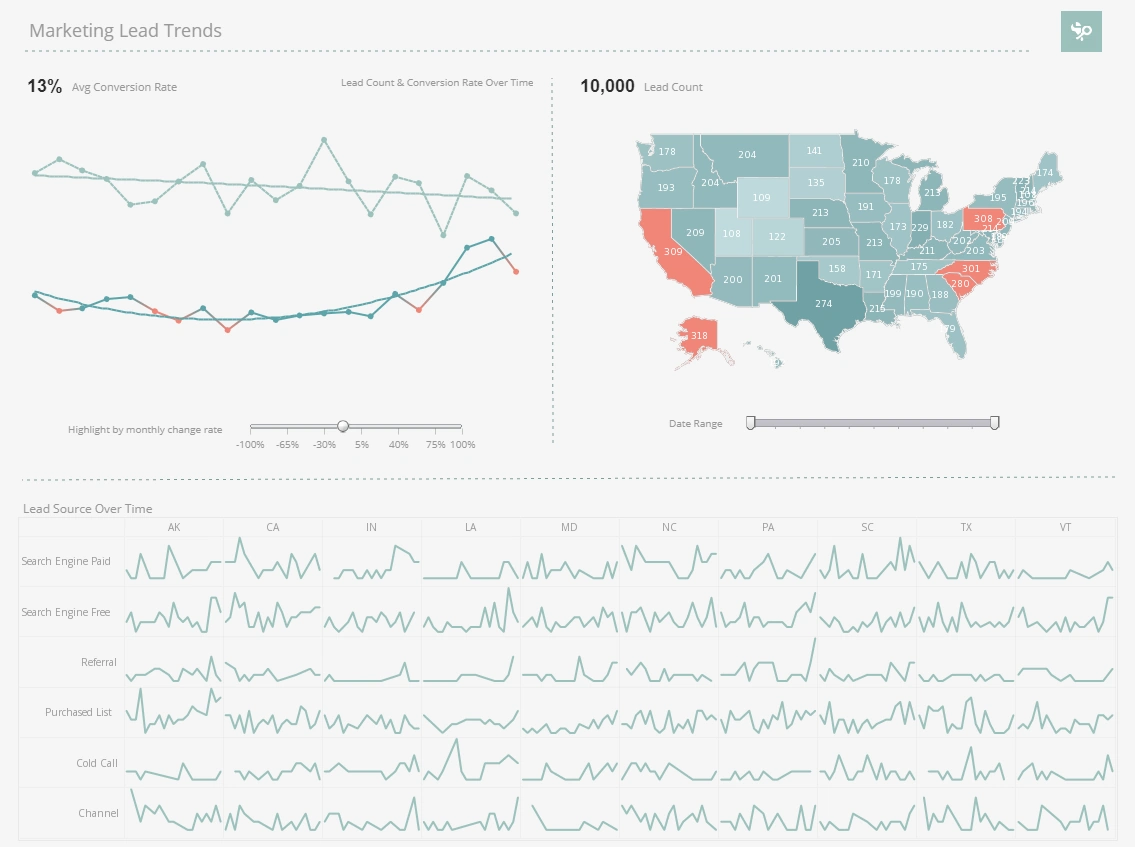
With a closer look into the dashboard, it's worth noting the flexability and the creation of a variety of graphs that are contained in its own part of the dashboard. Whether it be a bar graph, pie chart or even the date rage slider, these open source features lead the end user with focused efforts in identifying marketing metrics.
Powerful BI Architecture
Using a drag and drop interface, you are free to explore data through visualization that also allows you to create one on your own. Leading you to build interactive reports without having to be an IT expert, encouraging self-service and protecting data from being mishandled, InetSoft delivers world class service.
The next best thing about InetSofts easy to deploy web-based application and the open-standards-based technology is the easy integration and interactive reporting that can pull data directly from other applications. With InetSoft's BI tool you have the luxury of tracking multiple KPIs in one report, leaving you more time to do more of what you love and leading you to work smarter with InetSofts StyleBI.

Interactivity for Marketing Professionals
With brushing and drilling, you can very quickly view the specifics of what is performing better or identify the impact a single change can have on each of these performance measures. Additionally, data ports big data that gathers, combines, and measures performance over time. InetSoft's assimilated an intuitive application like this so that you can explore data and navigate even further into key perfomance indicators, going beyond the typical cost benefit anaylsis attributes that lead to success. In conjunction with the flexibility of the software, these BI tools not only help the end user master marketing metrics but also provides a sense of confidence in knowing your customers and business inside and out.
If you are operating a full fledged marketing campaign, but are looking for additional tools offered like with InetSoft tools, such as with these BI tools, then you can count on us to equip you with the innovation to act with urgency responding to requests from these campaigns and make your customers feel more understood and catered to while also targeting prospective clients. Rather than have your most valuable assest function to a certain capacity, why not consider InetSofts dashboard app that reports live to revolutionize your ability to deliver solutions for on-the-fly problems?! Gone are the days of excuses or work slowdowns. Oversight of out of office employee work becomes conclusive and efficient. Those employees also have the ability to get instant action from the system when they need it. Hot spots and trouble areas become less frequent as data culture meets business savy.