OEM Case Study: Take Control of Your Enterprise Governance, Risk and Compliance
The Protecht Group partnered with InetSoft to integrate the InetSoft Business Intelligence application into their risk management platform to enable engaging visualizations of data captured in their solution.
Protecht.ERM is Protecht's flagship enterprise risk management software and has been provided as Software as a Service (SaaS) since inception in 2002. Used by government agencies, regulators, financial service providers, fund managers, entertainment and retail companies, The solution allows organizations to seamlessly integrate risk management into their day to day activities and obtain operating efficiencies through its flexible forms and workflow engine.
Organizations can rapidly deploy and collaborate anywhere on risk and control assessments, compliance, key risk indicators, incident capture, compliance breaches, audits and more.
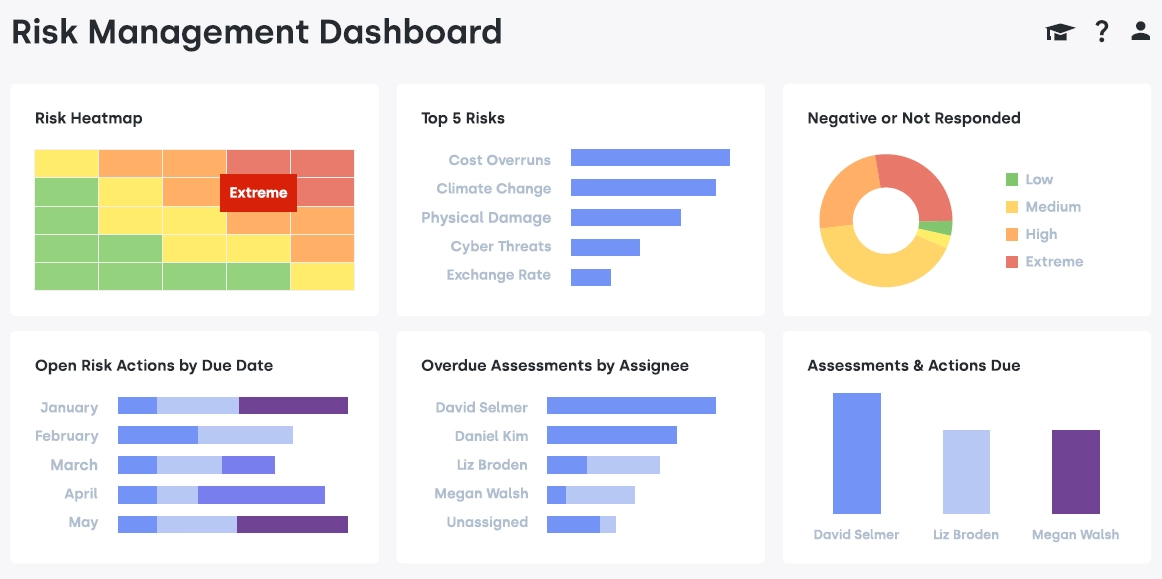

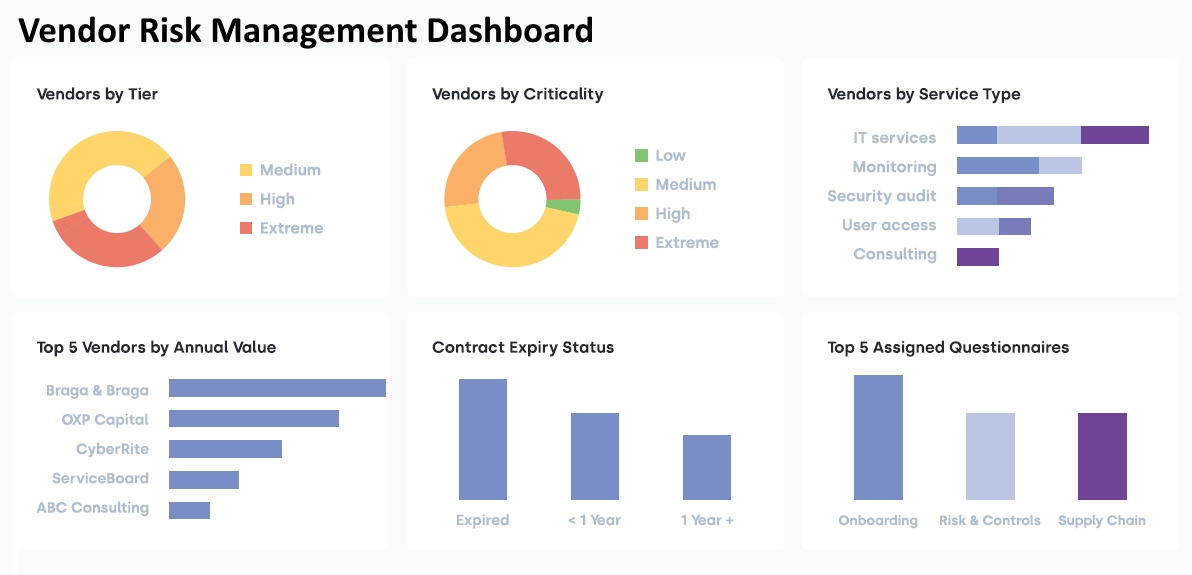
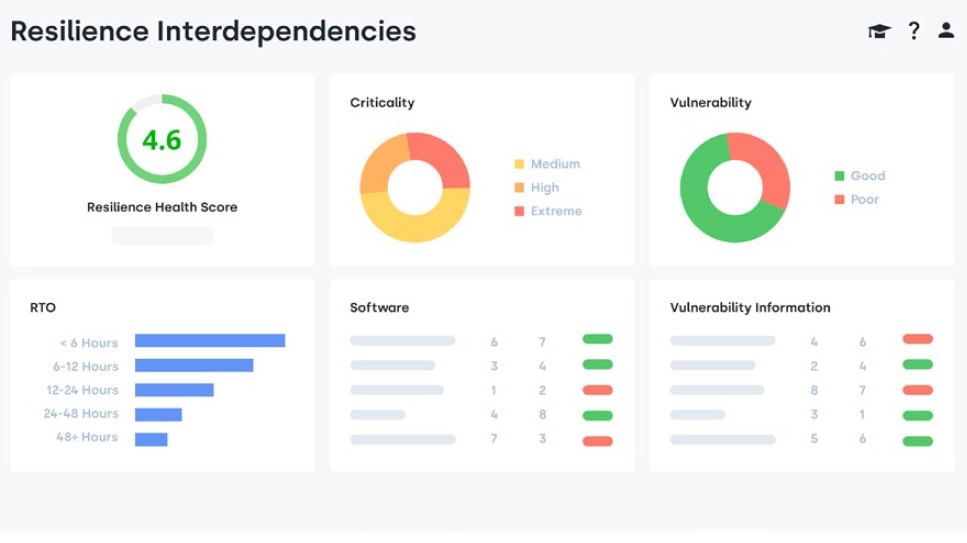
Module Showcase
Risk and Control Self-Assessment: Accommodate a user's risk assessment methodology and enables linkage with the central risk event and control libraries for aggregation in reports.
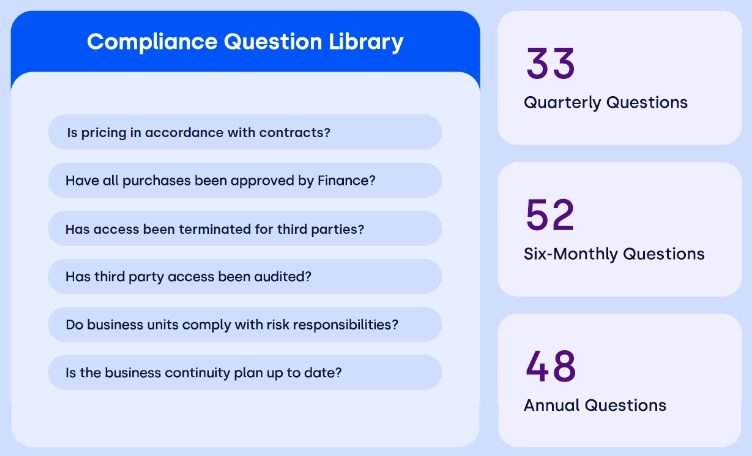
Compliance: Compliance Attestations can be created and scheduled for completion based on internal or external policies. Compliance attestations can be generated and scheduled to remind users of their compliance obligations on a regular basis. Compliance questions are able to be linked to risks, controls and obligations.
Key - Risk Indicators: Enables users to enter and track their KRIs and KPIs. Intelligent KRIs can look at the value of one or more KRIs to calculate a new value. Quickly and easily see trends in risks and performance metrics.
Internal Audit: Perform audits within the organization and enable auditors and auditees to communicate and agree on a mitigation plan.
Actions Management: Track agreed Action plans within the system. Monitor progress through Worklogs and set Workflows to remind assignees or escalate to managers.
Registers: Registers can be quickly and easily designed, built and deployed without the need for programming. Convert any paper or electronic forms into fully customizable registers.
Included Reports
- Incident Management
- WHS Management
- Complaints Management
- Document Management
- Property Maintenance
- Compliance Obligations
- Contracts Management
- Fraud Incident Management
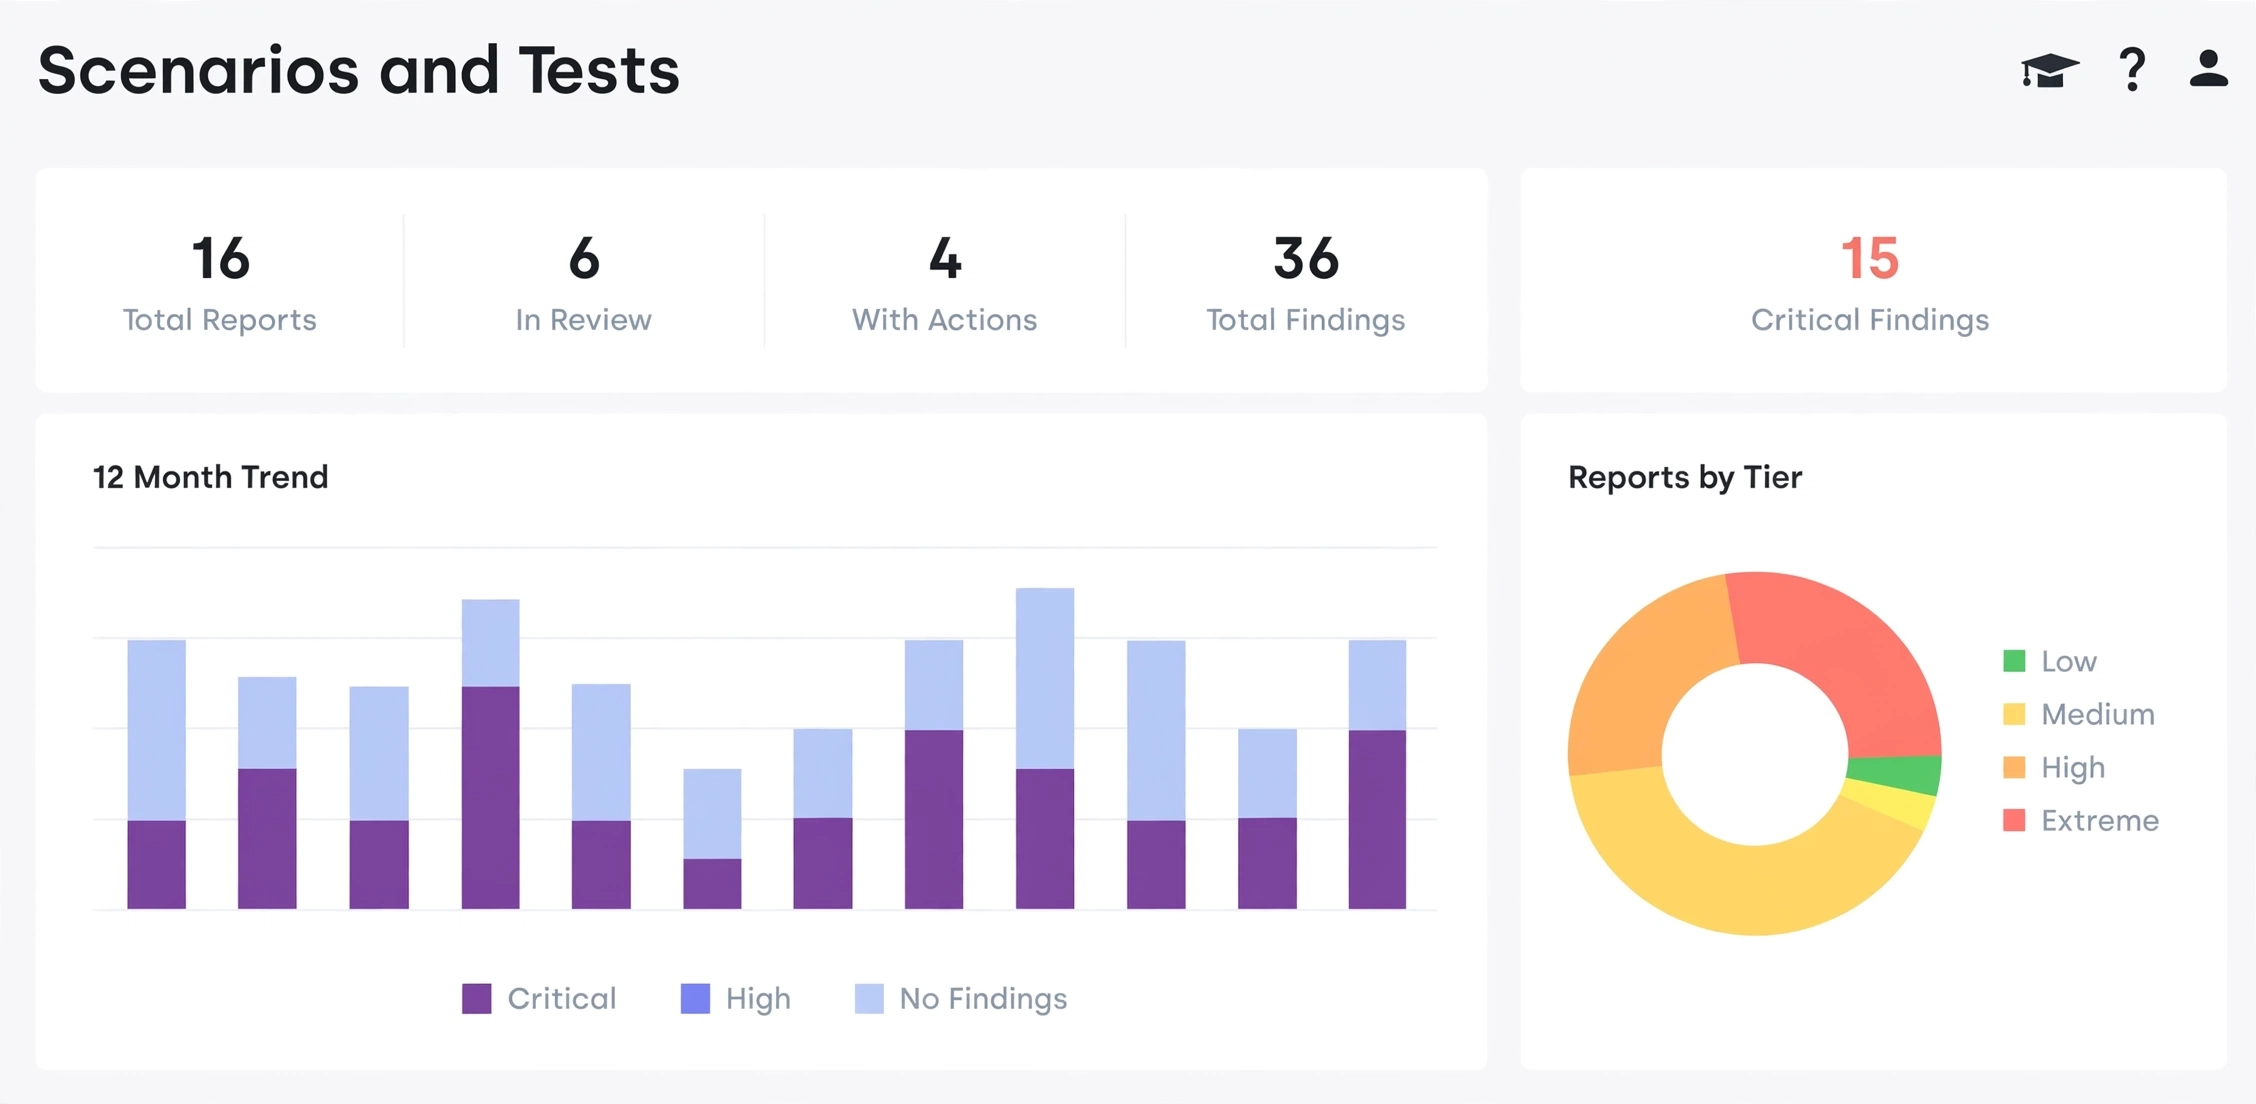
Key Components of a Risk Management Reporting Dashboard
A high-performing risk management reporting dashboard consolidates real-time indicators, emerging threats, and mitigation activity into a single operational view. To support rapid decision-making, the dashboard must surface the most critical risk signals with clear visual hierarchy and drill-down capability.
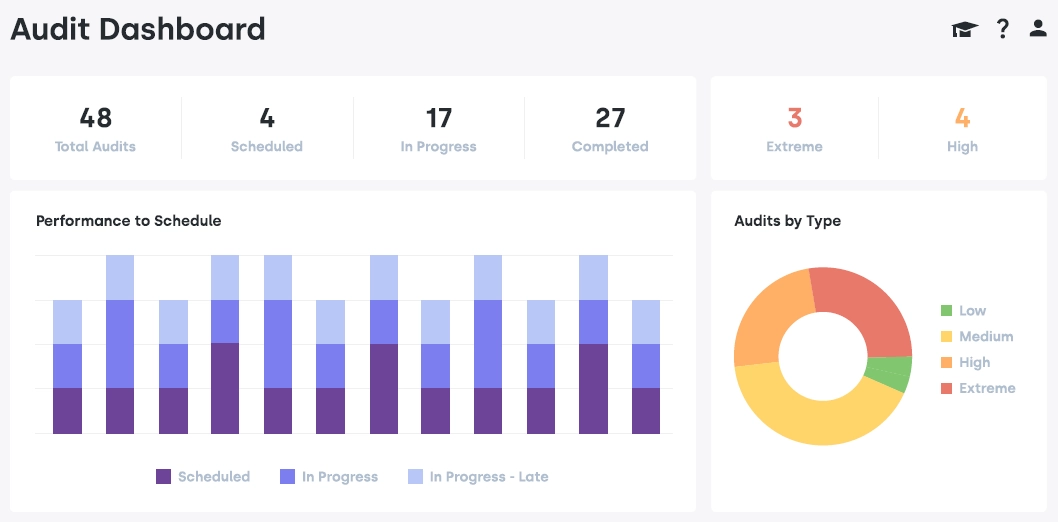
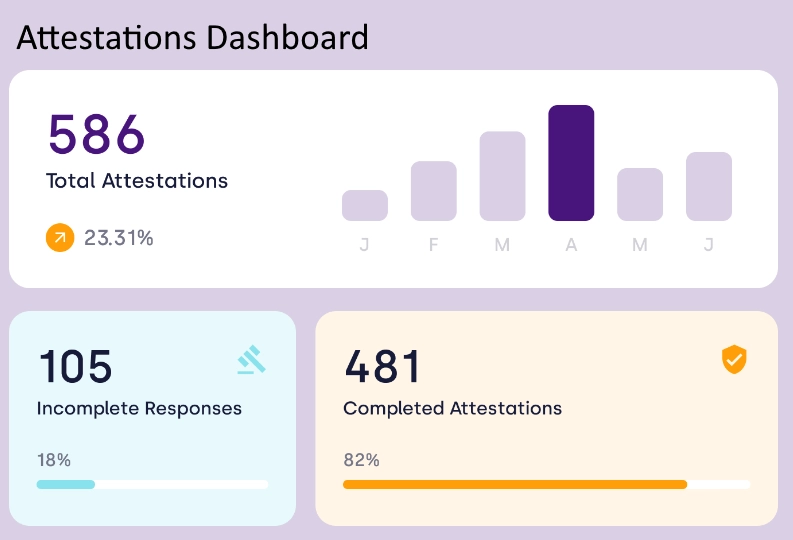
Additional Features
- Complete ERM package: Access the complete suite of ERM components ' risk, metrics, compliance, incidents, fraud, complaints, audit and more. Suitable and scalable for the needs of all stages of risk and compliance management maturity.
- Risk Analytics: Quickly turn data into highly visual dashboards and reports with the integration of InetSoft.
- Workflows: Automate escalation of exceptions and non-conformance to the right person.
- Central Libraries: Ensure data integrity by linking all data back to risk events, controls and business units stored in a central location.
- Tags: Create multi-dimensional connections between data from different components and forms.
- Custom Registers: Create customizable forms for incidents, events, contracts, obligations and more.
- Data Import: Migrate the data from other systems into new forms at the click of a button.
- Bulk Update: Easily manage data by modifying several fields at once.
- Compliance questions and surveys: Send recurring compliance questions or ad-hoc surveys for compliance and benchmarking.
- Mobile: Accessible on any tablet or mobile device.
Using InetSoft's StyleBI to Visualize the Data
Protecht.ERM integrates InetSoft StyleBI as its analytics module. The analytics module transforms risk data collected into beautifully designed dashboards. Once trained, users are able to create and update dashboards as they desire. These highly sophisticated reports and graphical dashboards can be tailored by users without needing to involve the IT department or the service provider, allowing for self-sufficiency.
Risk Analytics allows users to quickly and easily download reports and dashboards into PowerPoint, Excel or PDF formats at the push of a button. Risk reporting for Board and Risk Committees happens instantaneously, instead of through data manipulation in Excel.

More Risk Analytics Capabilities
- Data mashups - combine information from multiple data sources
- Ad-hoc information analysis: User can create ad-hoc analysis
- Predictive analysis: Apply predictive algorithms over the data
- Pixel perfect reports: Export and print the reports in high resolution
- Automation of legal/regulatory form output
- Scheduled reports - once the dashboard/report has been built, schedule them for deliver to anyone in the enterprise
- Interactive Dashboard:
- Drill down from high level to the details
- Slice and Dice combining and filtering the information
- Selections for different types of data
Risk Management Reporting Dashboard FAQs
What is a risk management reporting dashboard?
A risk management reporting dashboard is a real-time visual system that consolidates risk exposure, mitigation activity, incidents, controls, and compliance indicators into a single operational view. It helps teams identify emerging threats and take immediate action.
What KPIs should be included in a risk management dashboard?
Common KPIs include risk exposure levels, likelihood and impact scores, mitigation progress, overdue actions, incident frequency, control effectiveness, and compliance status.
Who uses risk management dashboards?
Risk managers, compliance officers, operational leaders, auditors, and executives rely on dashboards to monitor risk posture and ensure timely mitigation.
How does a risk management dashboard help decision-making?
Dashboards surface real-time alerts, highlight deviations from thresholds, and provide drill-down views that help teams understand root causes and prioritize mitigation efforts.
What data sources feed a risk management reporting dashboard?
Dashboards typically integrate data from incident management systems, audit logs, compliance tools, ERP systems, workflow platforms, and operational monitoring systems.
What makes a risk management dashboard effective?
Clear visual hierarchy, real-time updates, role-based views, actionable alerts, and unified multi-source data mashup are essential for an effective dashboard.

More Articles About KPI Dashboards
-
On-Time Performance metric
InetSoft’s aviation KPIs article explains the operational measures airlines and airports rely on to run reliably and profitably. It highlights On-Time Performance as a central metric and shows how delay drivers can be sliced by route, aircraft, and airport to reveal root causes. The piece also discusses passenger flow, load factor, and turnaround time as complementary indicators that feed operational decisions. Finally, it explains how interactive dashboards let operations teams move from observation to corrective action in near real-time.
-
Average Time To Sell
This FMCG article focuses on the speed-sensitive KPIs that matter in fast moving consumer goods businesses. It explains why metrics like Average Time To Sell and Inventory Turnover are critical to freshness, regulatory compliance, and margin protection. The write-up walks through how to present those KPIs on dashboards so product, merchandising, and supply chain teams can coordinate. It also calls out promotional lift and shelf capacity measures that frequently decide success or loss in the category.
-
Production times costs
The manufacturing operations article outlines the operational KPIs factory analysts use to boost throughput and reduce waste. It covers takt time, cycle time, yield, scrap rates, and how to compare production times against benchmarks to spot bottlenecks. The article shows examples of combining cost metrics with quality metrics so managers understand tradeoffs between speed and defects. It closes with suggestions for dashboard layouts that surface exceptions and support continuous improvement.
-
IT service performance metrics
The IT KPIs resource describes the commonly tracked metrics that measure technology delivery and support effectiveness. Topics include incident resolution SLAs, mean time to repair, system availability, and ticket backlog trends—metrics that influence user satisfaction and operational risk. The page explains the need for both high-level scorecards for executives and drillable views for operations teams to diagnose incidents. It emphasizes tying KPIs to business outcomes so IT investments are judged on value, not just uptime.
-
Preventive Care Compliance monitoring
This practice-management article reviews KPIs used by clinics and professional practices to track clinical quality, utilization, and revenue. Preventive Care Compliance is highlighted as an example clinical KPI that supports population health goals and payer requirements. The guidance covers appointment utilization, no-show rates, case mix, and revenue per visit as core performance indicators. It recommends dashboards that combine clinical and financial KPIs to align clinicians and administrators on shared targets.
-
Cost per Invoice processing
The billing operations article targets KPIs that measure the efficiency and compliance of invoice and billing workflows. It explains Cost per Invoice as a key efficiency metric and shows how to decompose it into labor, exceptions, and automation savings. Compliance and dispute rates are presented as risk metrics that directly affect revenue realization. The article recommends dashboards that blend throughput, accuracy, and aging to prioritize remediation work.
-
Evaluate the portfolio's ROI
The investment operations KPIs piece explains the performance and operational indicators used by portfolio and back-office teams. It describes how analysts use ROI, return attribution, and operational KPIs like trade error rates to assess both investment outcomes and process quality. The article stresses the importance of timeliness and reconciliation metrics to preserve fiduciary duty and regulatory compliance. It also outlines dashboard patterns that let teams pivot between aggregate performance and trade-level drilldowns.
-
Requirement Change Management
The requirements management article discusses KPIs and analytics that help product and project teams keep development on track. Requirement Change Management is presented as a vital area of measurement—tracking change frequency, impacted scope, and traceability to test coverage. The piece shows how dashboards can surface risky requirements, late changes, and test gaps that threaten delivery. It advocates pairing change and quality KPIs to reduce rework and improve predictability.
-
volume of silt removed
This earthwork estimating article highlights construction and civil-works KPIs used to monitor productivity and cost in site operations. It calls out specific operational measures such as dredging volume per day (the volume of silt removed) and machine utilization rates that directly influence project timelines and budgets. The article recommends dashboards that blend progress, cost‐to-complete, and equipment metrics for accurate forecasting. It also discusses how visual alerts for deviations help supervisors correct course quickly on active sites.
-
Monitor CO2 emissions
The KPIs analysis tool page shows how industry-specific KPI sets can be configured for real-time monitoring and decision support. In the context of heavy industries it highlights environmental and regulatory KPIs—examples include how to Monitor CO2 emissions alongside shipment and production tracking. The article demonstrates the flexibility of KPI tools to combine compliance, operational, and financial metrics in a single view. It closes by explaining how template KPI bundles speed deployment while remaining customizable to each company’s formulas.