Process Improvement Through a Sales Lead Tracking Dashboard
At InetSoft, we've just begun using a new dashboard for tracking our sales leads. You can see an example of this dashboard (with obscured information, of course) in the screenshot to the right.
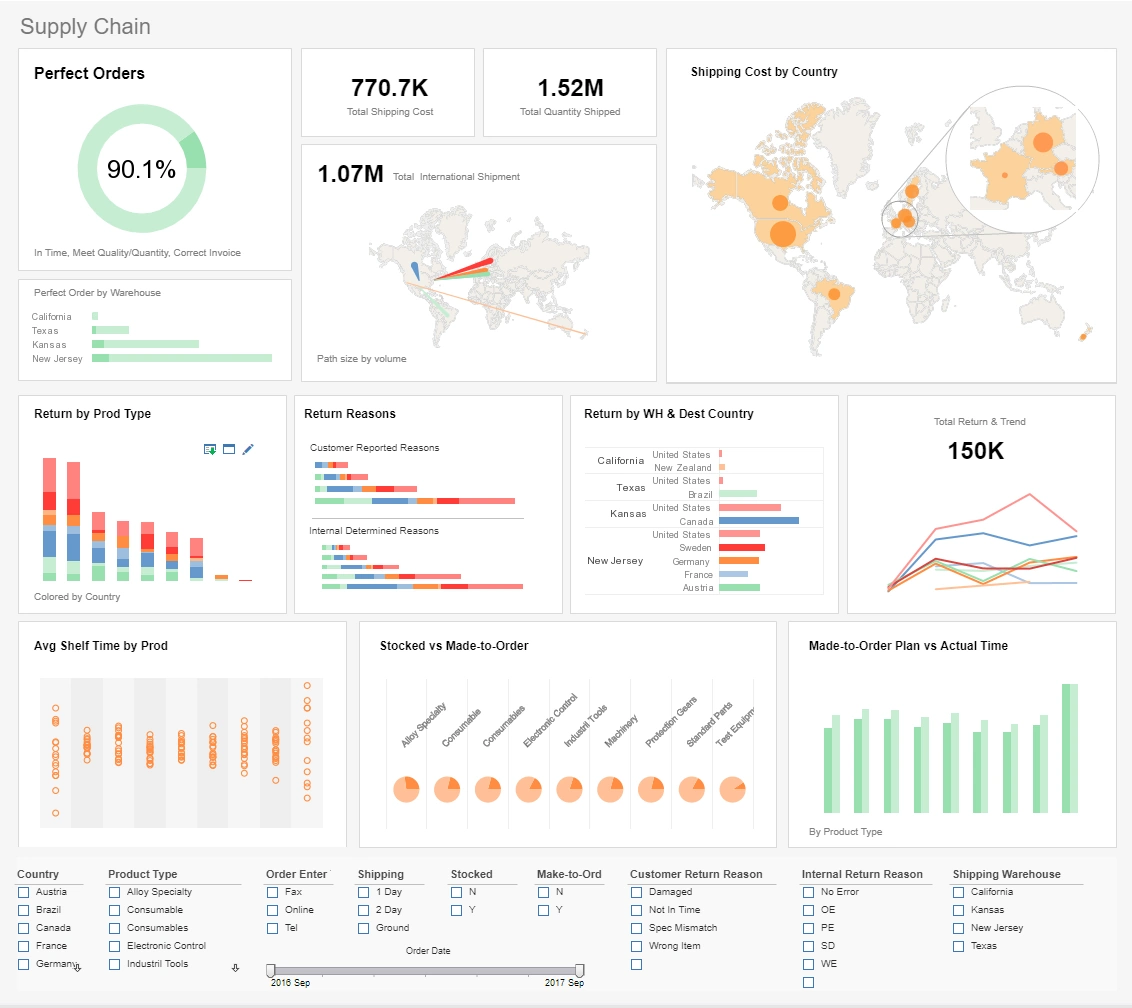
Essentially, what this dashboard does for us is allows our sales team to keep track of how many times a lead was emailed, called, or otherwise contacted by employees or automated measures. It provides our sales team with useful, actionable information that enhances lead conversion.

A Wide Variety of Features
This dashboard takes full advantage of the power of StyleBI, InetSoft's premier BI platform. If you opened the live interactive dashboard, you were able to experience what this dashboard truly offers.
Starting from the calendar, users of this dashboard can filter leads down to a specific date range and eliminate any data not of interest to them. Further filtering can be accomplished by using the selection lists to really narrow things down.
If a user is searching for a specific account, they need only type a portion of the name into the search bar and the dashboard will handle the rest. By clicking on a lead ID, our sales team can view all relevant information about that lead, but this feature is understandably not implemented in the public version.
Easy-to-use
Looking at this dashboard, you're probably thinking that it must have taken quite the technician to pull of something like that, right? Well, no, actually. This dashboard was created by a member or our marketing team with no knowledge of coding whatsoever.
A key feature of our software is how easy it is to use for business users. The interface for dashboard creation in Style Intelligene is completely drag-and-drop, allowing users like our marketing team member to create fully functioning dashboards.
Those with more of an IT background needn't fear, though. A full scripting environment is available for more powerful customization and data interaction.
Upgrading Dashboards: An Immersion Cooling System Manufacturer Moves from Nutshell to StyleBI
For an Immersion Cooling System Manufacturer—a company producing liquid-submersion cooling solutions for high-performance computing, cryptocurrency mining, and data centers—data-driven decision-making is critical. Every sale, installation, and maintenance cycle involves highly technical specifications, complex quoting, and close coordination with engineering teams. When this manufacturer chooses to migrate its dashboard and analytics platform from Nutshell to StyleBI, the move is more than a software upgrade; it’s a transformation of how operational intelligence supports sales, engineering, and executive decision-making.
Nutshell has traditionally served as a CRM-centric tool, focused primarily on contact management, basic pipeline reporting, and standard sales KPIs. While effective for monitoring leads and opportunities, it often falls short in more complex industries like immersion cooling, where sales, production, and logistics are tightly intertwined. StyleBI, by contrast, offers a more flexible and embeddable analytics platform that can handle multi-source datasets, support interactive dashboards, and integrate closely with both ERP and MES systems. This flexibility allows the company to not only track what has happened but also predict potential bottlenecks, evaluate custom cooling solution profitability, and visualize operational constraints in real-time.
The migration begins with a redesign of the underlying data model. Immersion cooling solutions often have highly configurable products: different dielectric fluids, tank sizes, pump configurations, and thermal performance options. These variables must be captured in a unified data model that can tie CRM opportunities to production schedules, inventory availability, and supplier lead times. StyleBI’s semantic layer provides a centralized, governed structure that allows sales, engineering, and operations teams to speak a common language. With this approach, each opportunity in the system can be analyzed not just for its revenue potential but for its production feasibility and margin risk.

One of the most immediate benefits of StyleBI is interactive and contextual dashboards. Sales teams can now see a visual representation of each potential deal’s configuration, including fluid type, tank size, and estimated lead time. Instead of static numbers, reps can interactively adjust specifications and immediately see how changes affect cost, delivery, and profitability. This interactivity reduces the need for multiple spreadsheet calculations, minimizes human error, and accelerates the quoting process. For an industry where a single mistake in fluid compatibility or thermal performance can have costly consequences, the ability to simulate outcomes in real-time is invaluable.
Integration with operational data is another key improvement. In immersion cooling manufacturing, production schedules, inventory levels, and testing cycles all impact what can realistically be promised to customers. Nutshell does not natively handle high-frequency operational telemetry, but StyleBI connects seamlessly with MES, ERP, and inventory systems. This allows the dashboards to flag potential delays, component shortages, or quality testing failures before they impact sales. As a result, sales teams can communicate proactively with clients, offer alternative solutions, or adjust lead times, thereby preserving customer satisfaction and trust.
Governance and data accuracy are critical in this industry, and migrating to StyleBI helps standardize metrics across departments. Previously, different teams might have used inconsistent definitions for production costs, lead times, or margin calculations. With StyleBI, all KPIs—from cost per cooling unit to expected installation date—are defined centrally and enforced across dashboards. This reduces disputes, ensures alignment between sales, engineering, and operations, and gives executives a trustworthy view of the business. Role-based access control also ensures sensitive information like pricing models and strategic customer data are visible only to authorized personnel.

From a user adoption perspective, the migration is carefully staged. Early on, a pilot team of sales and engineering power users helps design the initial dashboards and interactive views. By involving end users in the process, the company ensures that the final dashboards align with real workflows rather than forcing teams to adapt to generic templates. Training emphasizes speed and clarity: sales reps learn to generate a fully margin-aware quote in seconds, while engineers can quickly verify whether production can meet requested specifications. Early wins like reduced quote cycle time and fewer configuration errors build confidence in the new system.
Monitoring success is straightforward with a set of targeted KPIs. Sales teams can track quote-to-order conversion rates, average quote turnaround time, pipeline health, and forecast accuracy. Operational KPIs include on-time delivery against promised dates, production bottlenecks, and the percentage of quotes requiring manual engineering adjustments. Adoption metrics such as dashboard access frequency, number of interactive simulations run, and reduction in spreadsheet uploads are also tracked to ensure the new system is actually used. Within months, the company can expect faster quoting, fewer production surprises, and higher margins on custom solutions.
Cost considerations are an important part of the migration. StyleBI’s flexible licensing and embedding capabilities provide long-term value, enabling dashboards to be integrated into internal portals or even shared with strategic clients for transparency. The ROI model includes savings from reduced manual reporting, fewer expedited shipments, and reclaimed staff time, balanced against one-time implementation costs such as data model redesign, ETL rework, and dashboard creation. For a manufacturer of high-value, technically complex systems, the benefits of improved accuracy, faster sales cycles, and operational transparency typically outweigh the initial investment.
Strategically, this migration opens the door for advanced analytics. Predictive models can later be added to forecast production bottlenecks, estimate potential rework, and model thermal performance risks. Executive dashboards can combine sales, operational, and financial KPIs in real-time, supporting more informed strategic planning. Additionally, customer-facing dashboards showing installation progress or projected shipment dates can enhance client relationships and loyalty, offering a clear differentiator in a competitive niche market. In essence, moving from Nutshell to StyleBI transforms sales and operations from reactive reporting to proactive decision-making.