Visual Analytics Evaluation
Since 1996, InetSoft has offered its visually stunning analytical dashboard software to enterprises and OEMs alike. InetSoft's StyleBI&trade is a comprehensive platform that will redefine your consolidation, reporting, and performance management functions in one easy, agile, and robust dashboard.
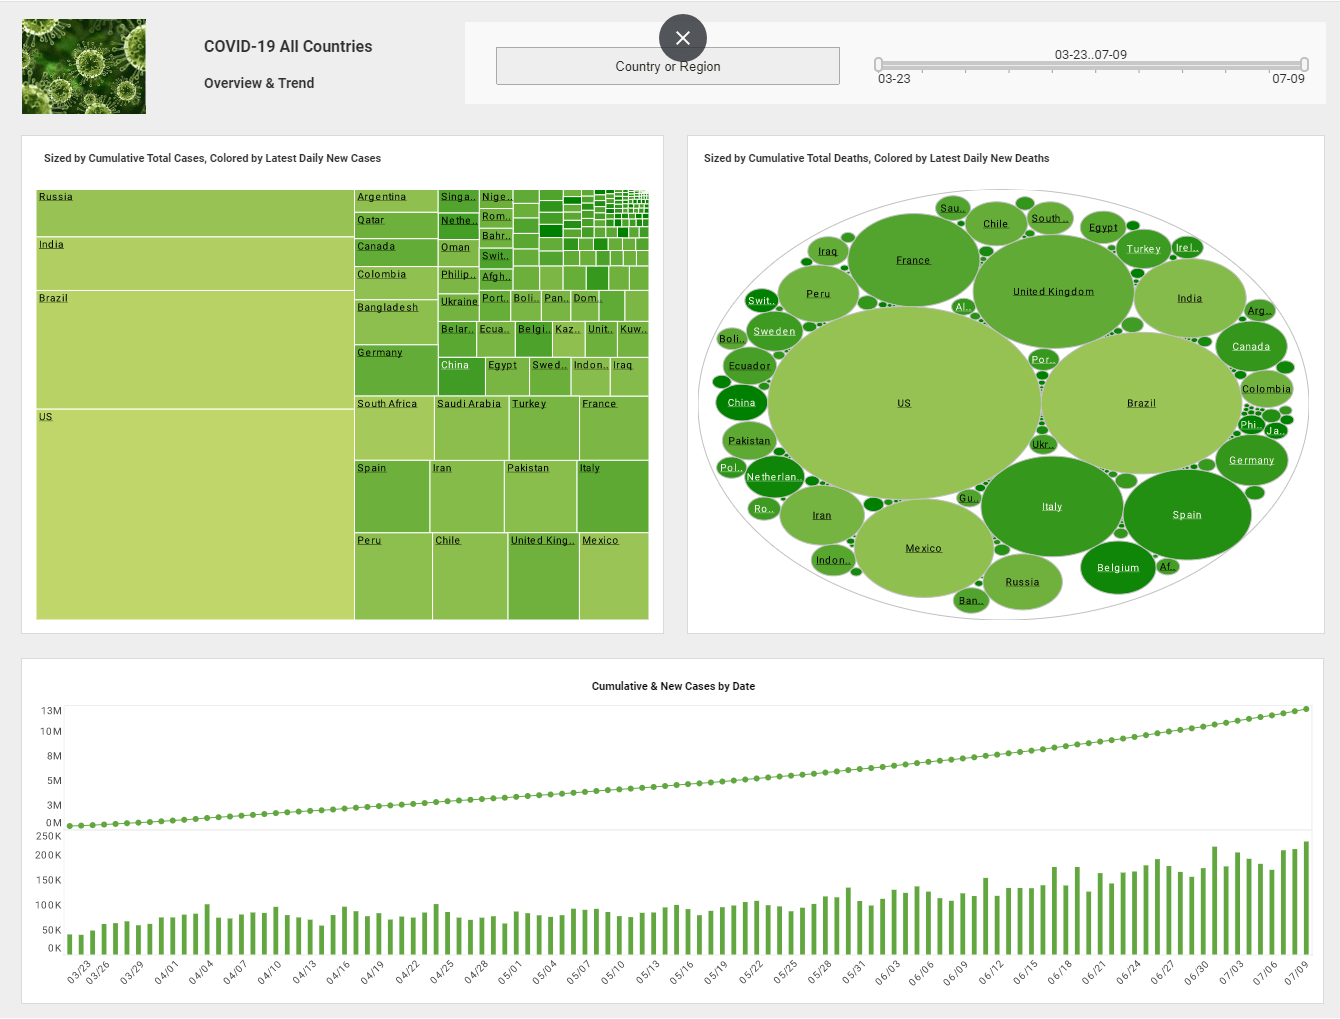
Visual analysis is a relatively new innovation in information management software that allows a person to explore data in an interactive, visual manner. At its simplest, it means charting and graphing data, but the novelty is in multi-dimensional charting and interactivity.
| #1 Ranking: Read how InetSoft was rated #1 for user adoption in G2's user survey-based index | Read More |
Evaluate Multi-dimensional Charting
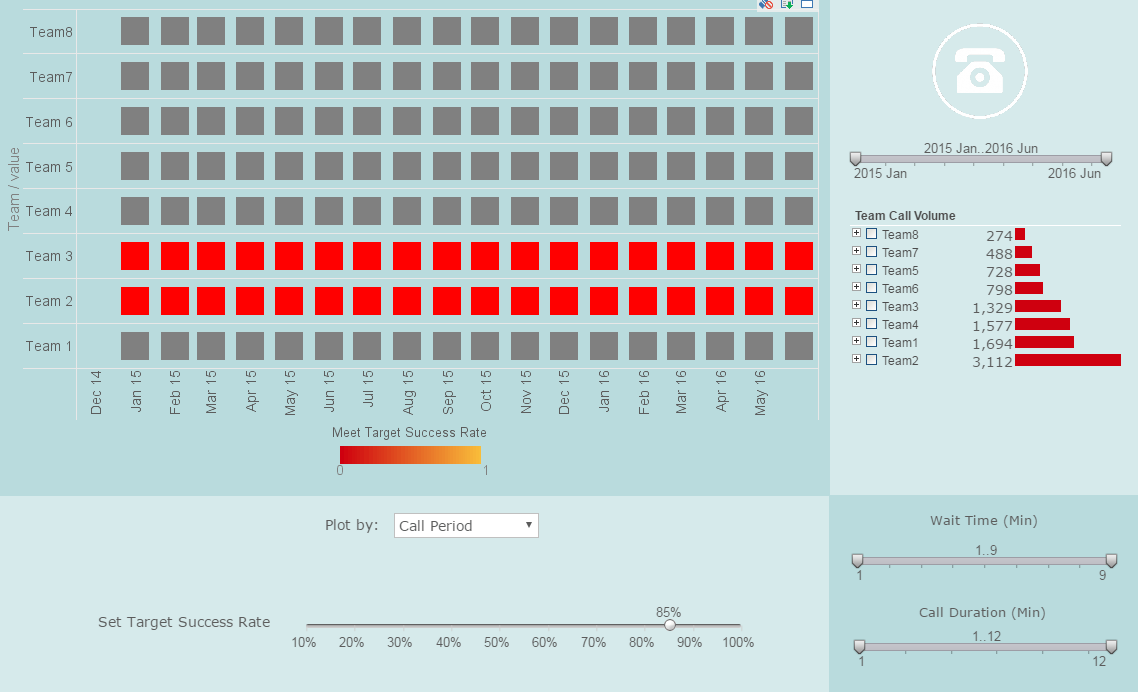
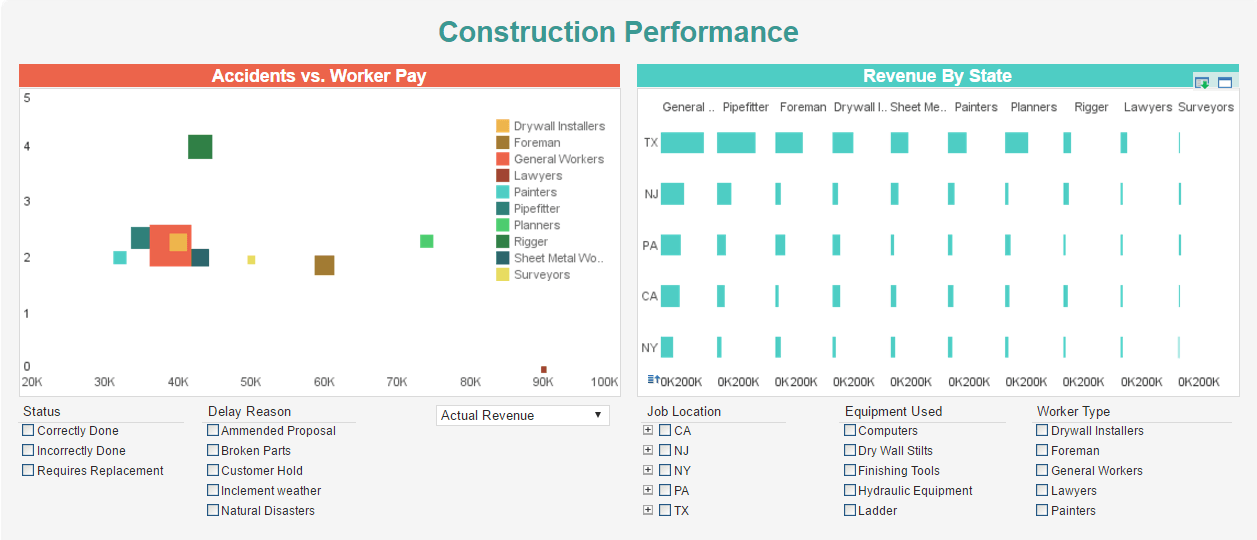
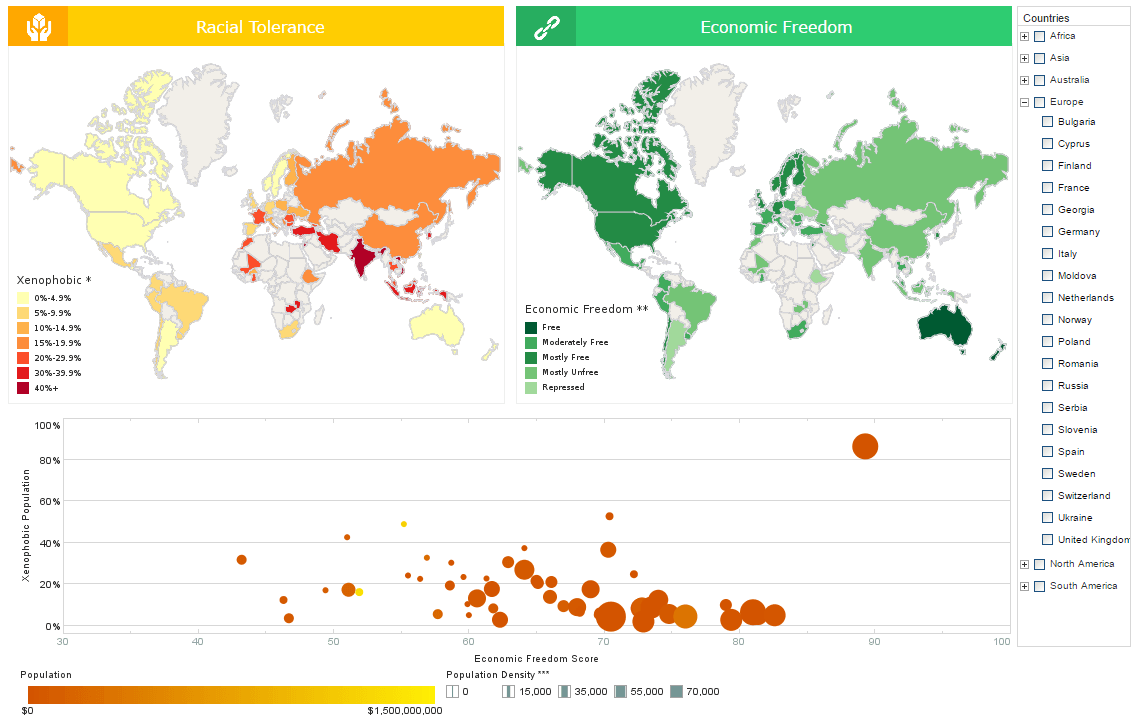
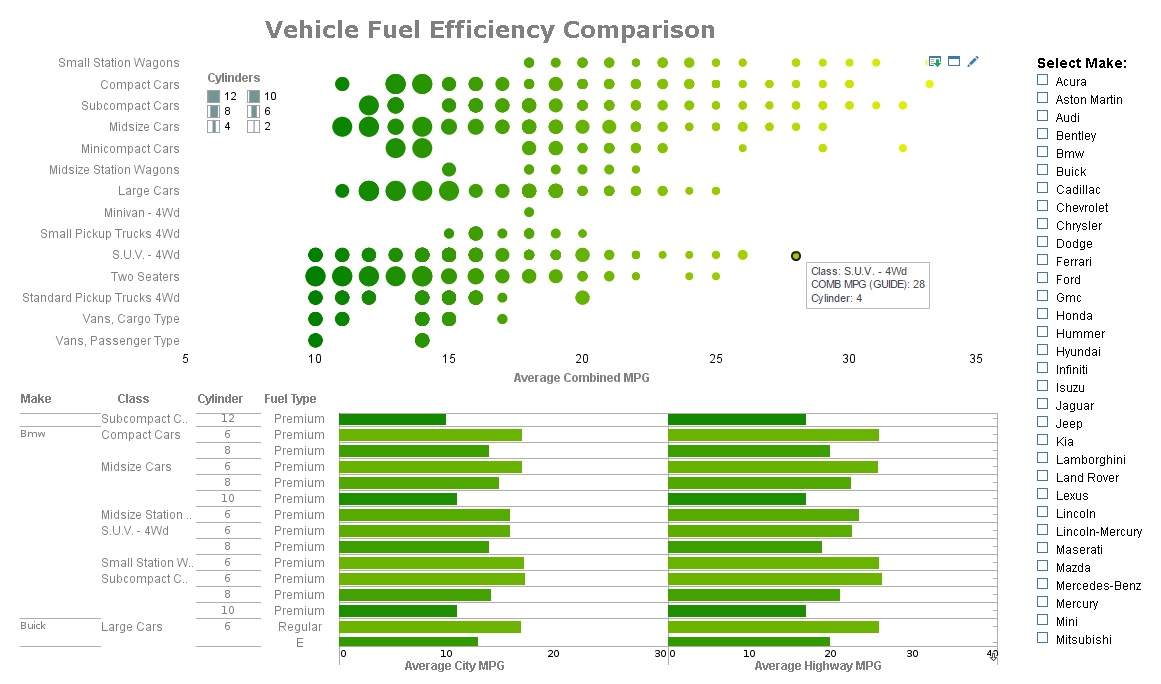
Multi-dimensional charting allows you to add coloring and implement sizing options. Coloring means coloring different data points on a two-dimensional chart to denote more information.
For example start with a graph of sales opportunities where closing probability is depicted on the y-axis and days until expected close date on the y-axis, with dots represented a single opportunity. You would already be able to identify imminently winnable opportunities in the upper left corner.
Now color the dots by sales person, a different color for each person. Now a scan of the color patterns shows who has more open opportunities and where they are in the likelihood and timeliness to close.
Add another dimension by sizing those dots by dollar amount, such that the larger the revenue potential of the opportunity, the larger the circle is. Now, at a glance you can prioritize opportunities to focus on.
Visual Analytical Dashboards
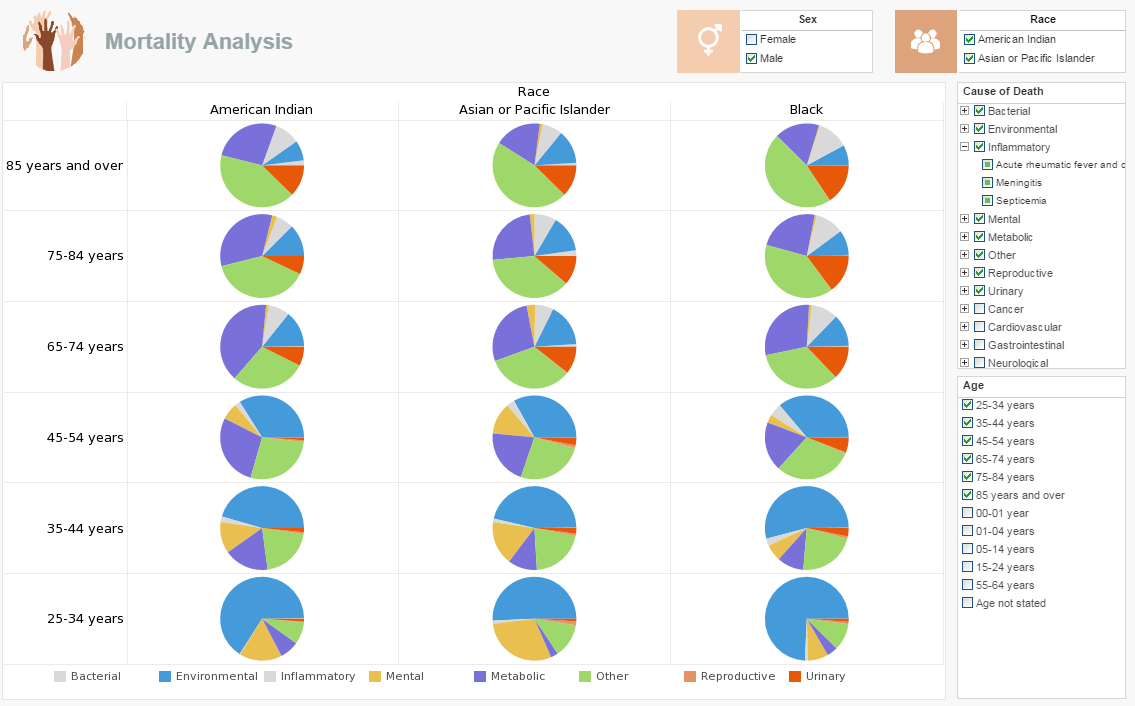
In addition to advanced charting function, our analytical dashboard software uses a visualization-driven approach to enable rapid deployment for quicker decision making. Evaluate how our dashboards are primarily business user-driven, not IT driven. Some key advantages are:
- Monitor, explore, and analyze and drilldown into details
- Easy to use, modify, and create
- Leverage user-driven data mashup
- Suitable for executive to end-user
Analytical Functionality in One Application
In contrast to other business intelligence applications that provide only reporting, or only dashboards, or require an intermediate data access layer, InetSoft's StyleBI™ is complete. It includes visually sophisticated analytics tools and reporting capabilities. Here are some advantages:
- Drill - down across views and into details
- Large variety of chart types including custom geographic mapping
- Easy use of charts, maps, gauges, thermometers, and other visual displays
- Drag & drop design, spreadsheet-like design
- Export to Excel, PowerPoint, PDF, RTF-Word, CSV, PostScript, Text, and SVG
- Snapshot archiving
- Use web based mobile dashboards with devices such as iPhones,smartphones, Apple based & Android-based tablets
- Compatible with standard web browsers (i.e. Chrome, Internet Explorer, Firefox, Safari) with or without a Flash plugin
- Monitoring & analysis oriented views
- Dual purpose input/output elements
- Views assembled from sub-level views
 |
Read how InetSoft was rated #3 for implementation in G2 Crowd's user survey-based index. |


