Data Visualization Software and Dashboards for OLAP Databases
InetSoft's dashboard and data visualization software can access many of the popular OLAP databases such as Oracle Hyperion Essbase, Oracle OLAP, MS Analysis Server, and SAP NetWeaver BW.
In addition to accessing a single OLAP server for advanced dashboarding and analytics, InetSoft's powerful data mashup engine allows for combining and manipulating data with other data types (see All Data Sources for others), saving on additional ETL efforts.
With a small-footprint server, agile data access, and intuitive design tools, InetSoft's StyleBI delivers the IT-friendliest database reporting tools for user-friendly self-service business intelligence.

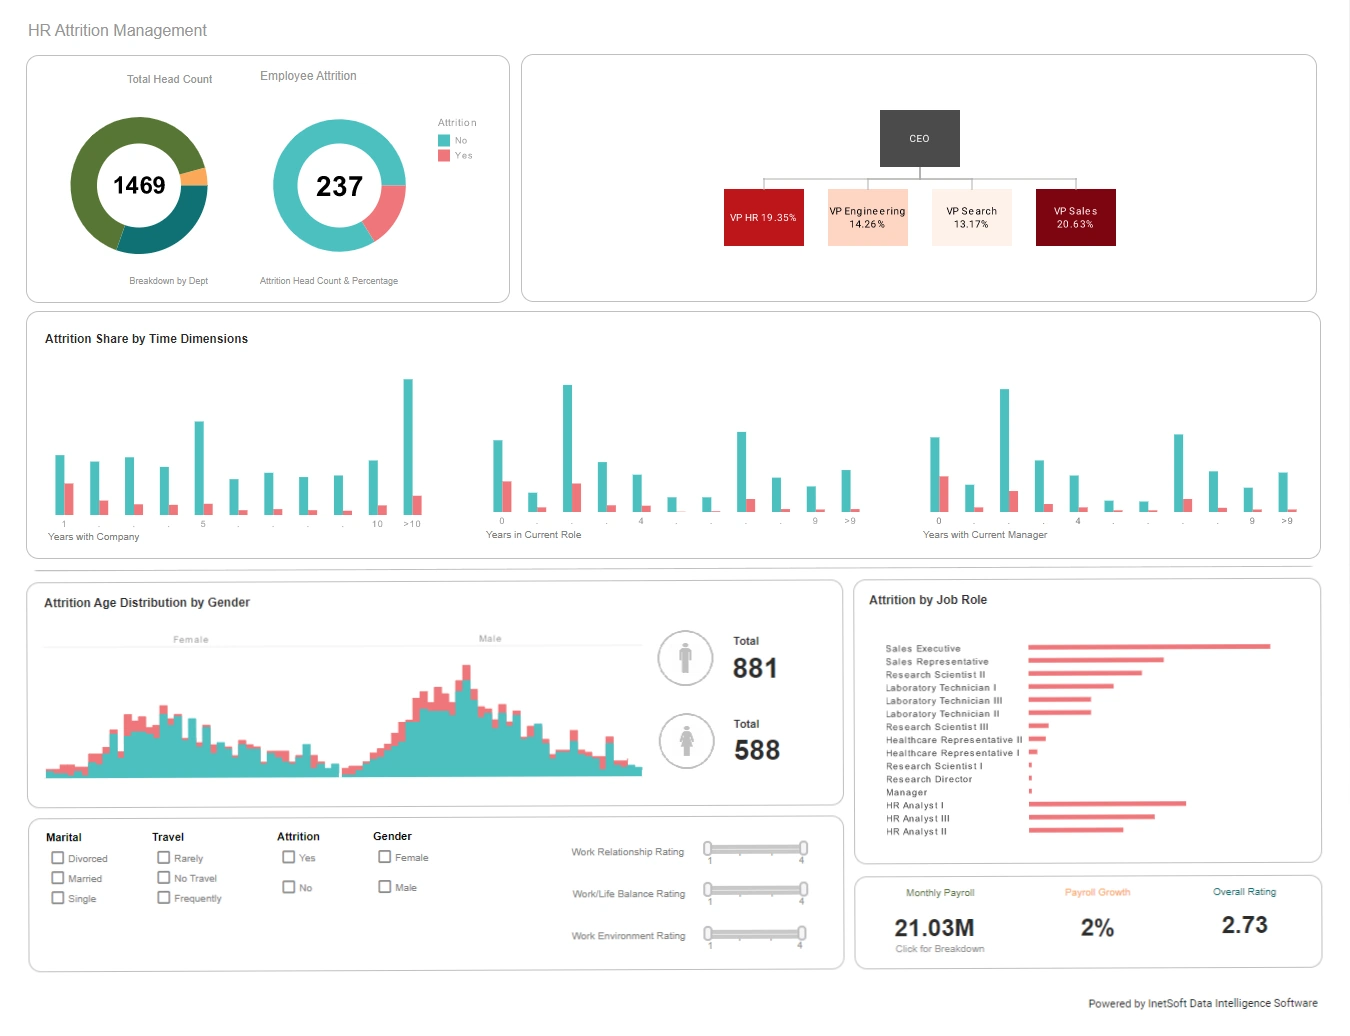
Build Interactive Dashboards
Get more value out of the data that is stored so thoughtfully in your OLAP server. Give the organization Web-basd dashboards that indviduals of all technical skill levels can use from any device, whether desktops, laptops, mobile phones or tablets.
InetSoft's StyleBI includes traditional reporting capabilities with very mature feature sets such as for creating production reports, but the visualization technology makes information consumption far more efficient enabling managers and analysts to perceive performance changes at a glance and drill through the data with simple pointing and clicking in order to trace the roots of the changes.
Build Mashups of Your Warehouse Data and Other Enterprise Data
A key strength of InetSoft's business intelligence solutions is its depth of support for data mashups. Data from one or more OLAP cubes can be combined with almost any other data source found in your enterprise including: relational databases, XML, SOAP, Java beans (POJO), EJB beans, column-based data warehouses, Hadoop/HIVE, SAP ERP, PeopleSoft, Siebel CRM, Google AdWords & Analytics, JDE, salesforce.com, MapR, SAP HANA and more.
In addition, InetSoft has innovated unique self-service capabilities for enterprise mashups. You do not have to be a BI analyst to create your own mashups. Simply import your spreadsheet and drag and drop similar fields to combine disparate tables and fields that were not previously mapped in a data model. Whatever dashboards or reports you make from them are now shareable inside the enterprise BI space.
Create Advanced Data Visualizations
StyleBI includes advanced data visualization types to be used on multi-dimensional data. From bubble charts to bullet graphs to heatmaps, point and click visual anaylsis is the way to detect patterns and outliers and discover useful findings from mountains of data, especially big data, and to represent performance data in the most efficient way possible.
Jojoba Oil Extraction and Refinement Switching from Tableau to StyleBI for OLAP Data Visualization
The jojoba oil extraction and refinement industry, though relatively small and specialized, relies heavily on data analytics to optimize production, monitor quality, and manage supply chains efficiently. The transition from Tableau to StyleBI for visualizing data from an OLAP database offers this industry a more agile and embedded approach to analytics, enabling operational efficiency, better resource allocation, and improved decision-making across production, logistics, and sales functions.
Overview of the Jojoba Oil Industry
Jojoba oil is derived from the seeds of the Simmondsia chinensis plant, cultivated primarily in arid climates due to its drought tolerance. The oil is unique in its chemical composition, resembling human sebum, which makes it highly valuable in cosmetics, skincare products, and industrial applications such as lubricants. Producers face challenges in managing agricultural yields, extraction efficiency, and quality standards while coordinating with distributors and regulatory bodies. Data-driven insights are therefore critical in ensuring the profitability and sustainability of operations.
Importance of OLAP Data for Jojoba Oil Operations
Online Analytical Processing (OLAP) databases allow jojoba oil manufacturers to aggregate large volumes of multidimensional data from cultivation, extraction, refining, and sales. This includes metrics such as seed harvest volumes, extraction yields, oil purity levels, batch-specific chemical compositions, energy consumption, and shipping logistics. The OLAP structure supports slicing and dicing data across multiple dimensions, including time, batch, location, and process stage, which is essential for understanding patterns, identifying anomalies, and optimizing operations.
Limitations of Tableau in this Industry Context
Tableau has historically served as a popular solution for visual analytics in many industries, including agricultural production. However, for jojoba oil producers, Tableau presents certain limitations. Firstly, embedding Tableau visualizations directly into internal production dashboards or ERP systems can be cumbersome and require additional IT resources. Secondly, while Tableau handles OLAP data, complex multidimensional calculations and dynamic aggregations often necessitate pre-processed datasets or additional modeling layers, slowing down the insight generation process. Lastly, Tableau’s licensing model and deployment overhead may be less flexible for smaller niche industries operating on tighter budgets.
Advantages of Switching to StyleBI
StyleBI provides an embedded analytics platform designed to integrate directly with existing systems and OLAP databases. Its interactive visualization capabilities and real-time connectivity to multidimensional data sources are particularly advantageous for jojoba oil producers. Key benefits include:
- Embedded dashboards: StyleBI allows the seamless embedding of interactive dashboards into internal applications, reducing friction for production managers, quality engineers, and logistics coordinators.
- Direct OLAP connectivity: The platform connects natively to OLAP databases, enabling live querying of multi-dimensional data without requiring pre-aggregated extracts.
- Interactive drill-downs: Users can drill into batch-level or process-specific data directly from high-level summary charts, facilitating root-cause analysis of production inefficiencies or quality issues.
- Role-based views: Operators, engineers, and executives can each have dashboards tailored to their operational responsibilities, reducing information overload while ensuring critical metrics are visible.

Operational Dashboards for Jojoba Oil Production
StyleBI enables the creation of highly specialized dashboards tailored to the various stages of jojoba oil extraction and refinement. Examples of critical dashboards include:
- Harvest Monitoring: Displays data on seed collection volumes, moisture content, and quality grades, enabling managers to identify optimal harvest windows and predict extraction yields.
- Extraction Efficiency: Monitors press performance, yield ratios, and energy usage in real time. Interactive visualizations allow engineers to compare batch performance across multiple processing units and adjust extraction parameters for maximum efficiency.
- Refinement Quality Control: Tracks chemical composition metrics, filtration efficiency, and contaminants. StyleBI supports overlaying historical data to detect deviations and maintain product consistency.
- Supply Chain and Logistics: Visualizes stock levels, shipment schedules, and demand forecasts. Real-time dashboards can help optimize inventory allocation and minimize storage costs for perishable seed inputs or refined oil.
- Financial and Operational KPIs: Combines production data with revenue and cost metrics, allowing executives to assess margins per batch, energy consumption costs, and labor efficiency.
Visual Analytics Capabilities in StyleBI
StyleBI’s visual analytics tools allow jojoba oil producers to generate rich, interactive visualizations directly from their OLAP data. Time-series charts track extraction yields and purity over multiple seasons, helping identify trends or recurring issues. Heatmaps of batch performance can highlight equipment inefficiencies or high-error processes. Scatter plots and correlation matrices enable analysis of complex relationships, such as the impact of seed moisture content on final oil quality or energy consumption versus extraction yield. These visual insights support more precise decision-making and process optimization.
Driving KPIs with Data-Driven Decisions
Using StyleBI, jojoba oil producers can focus on key performance indicators (KPIs) that directly influence profitability and quality:
- Extraction Yield Percentage: Visualizations can reveal underperforming presses, allowing engineers to adjust settings or schedule maintenance.
- Oil Purity Index: Batch-level monitoring of chemical composition ensures the oil meets cosmetic and industrial standards.
- Energy Consumption per Liter of Oil: Dashboards allow tracking of energy efficiency across production units, identifying areas for cost reduction.
- Batch Defect Rate: Monitoring deviations from standard parameters allows timely interventions to reduce wastage.
- Production Throughput: Daily and weekly throughput dashboards help balance resource allocation and labor planning to meet market demand.

Operational Forecasting and Optimization
StyleBI can enhance forecasting and optimization in jojoba oil operations. Historical production and yield data can be visualized to forecast seed requirements for upcoming harvests and predict extraction capacity needs. Scenario analysis can simulate the impact of machine downtime, changes in moisture content, or variations in labor availability. Interactive dashboards allow operators to test “what-if” scenarios and implement proactive measures to minimize disruptions, optimize energy usage, and maintain quality standards.
Embedded Reporting and Compliance
Regulatory compliance is critical in the jojoba oil industry, especially for producers exporting to markets with stringent cosmetic and food-grade standards. StyleBI simplifies reporting by allowing embedded visual dashboards that can generate scheduled reports directly from OLAP data. Reports on batch quality, chemical composition, traceability, and process logs can be automatically formatted and distributed to internal stakeholders or external regulatory authorities, reducing manual effort and ensuring accuracy.
Implementation Strategy for Transition
The transition from Tableau to StyleBI requires a structured approach to minimize disruption and maximize value:
- Data Mapping: Identify all existing OLAP cubes and dashboards in Tableau, ensuring equivalent data access in StyleBI.
- Dashboard Prioritization: Begin with high-impact dashboards for production, quality control, and logistics, before expanding to finance and sales analytics.
- User Training: Train operators, engineers, and managers on StyleBI’s interactive dashboards, drill-down capabilities, and embedded features.
- Validation and Parallel Run: Conduct a period where both Tableau and StyleBI dashboards operate in parallel, ensuring consistency and accuracy.
- Full Deployment: Once validated, fully migrate to StyleBI with embedded dashboards integrated into internal applications and ERP systems.

Benefits Achieved Post-Migration
Following the migration to StyleBI, jojoba oil producers can expect tangible benefits. The embedded dashboards reduce the need for switching between applications, saving time and improving adoption among operators. Real-time connectivity to OLAP databases allows for quicker response to process deviations and operational bottlenecks. Enhanced visualization and interactivity enable more precise root-cause analysis, better forecasting, and improved KPI monitoring. Financially, the flexibility and scalability of StyleBI can reduce licensing costs while supporting deeper insights across the supply chain and production lifecycle.
Strategic Implications
Adopting StyleBI positions jojoba oil producers for long-term strategic benefits. Embedded visual analytics allow for faster decision cycles, better resource allocation, and more proactive quality management. Insights from OLAP data enable predictive maintenance, energy optimization, and operational forecasting. Moreover, the ability to tailor dashboards to specific roles ensures that each stakeholder receives the information necessary to make informed, data-driven decisions, enhancing overall operational efficiency and competitiveness in the market.