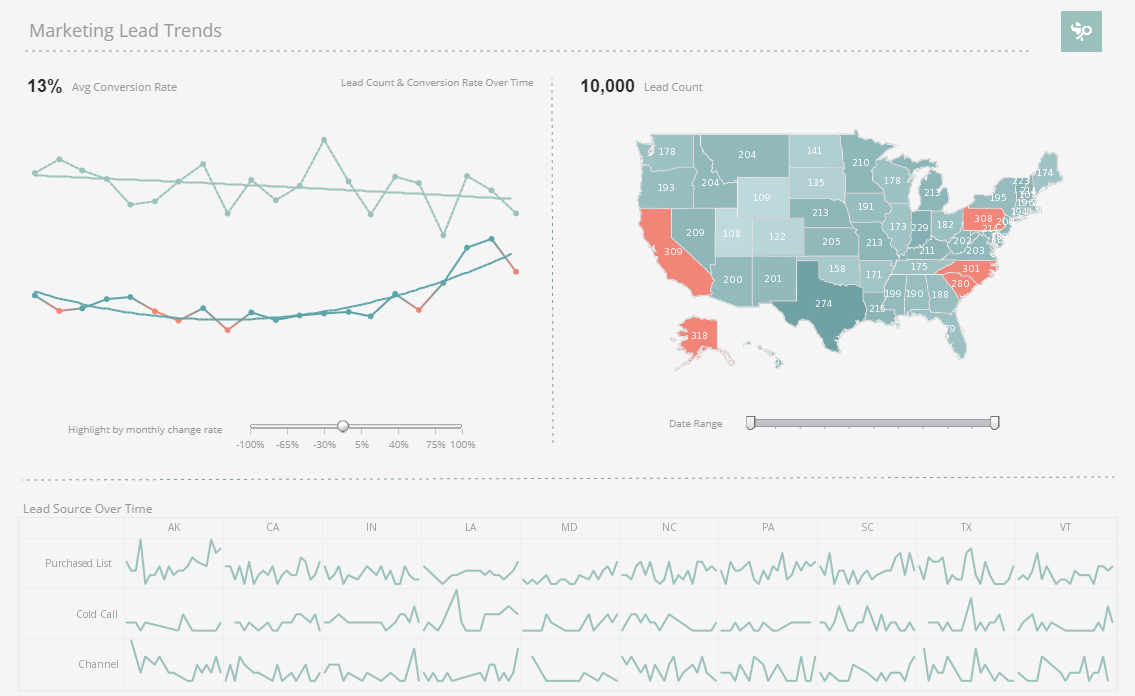
Data dashboards allow you to quickly view KPIs for different departments within your organization. These industry specific visualization dashboards allow you to get a feel for how easy it to use InetSoft’s data dashboard software.


August 12, 2022

Data dashboards allow you to quickly view KPIs for different departments within your organization. These industry specific visualization dashboards allow you to get a feel for how easy it to use InetSoft’s data dashboard software.