-
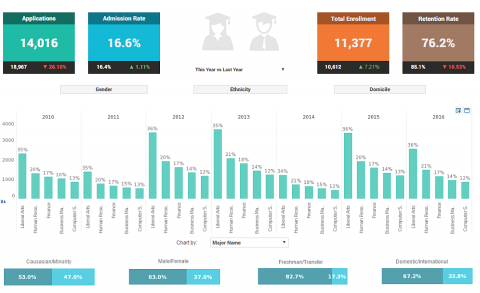
College KPI Dashboard
Read moreHow can data visualization help admissions officers track student enrollment patterns? Check out this interactive College KPI Dashboard from...
May 17, 20193 -
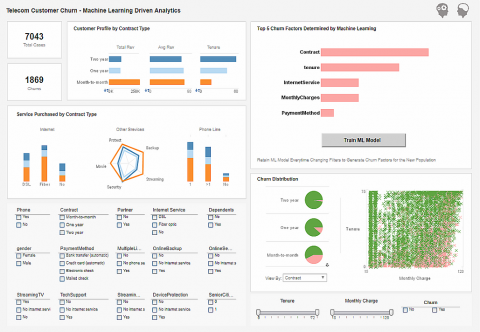
A Machine Learning Dashboard to Predict Customer Churn
Read moreLooking for a hands-on example of how machine learning dashboards can be integrated with interactive visualizations? Click on the...
-
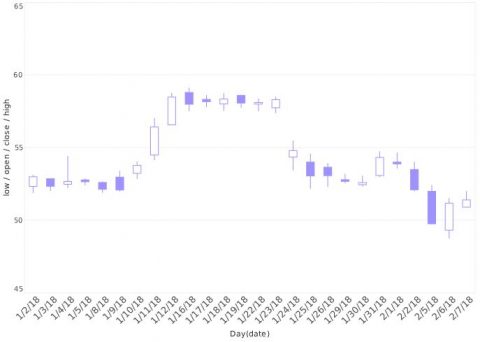
Tracking Financial Asset Fluctuations with Candlestick Chart Analysis
Read moreIn previous posts, we’ve discussed how different charts are more effective for different purposes, with bar charts and scatter...
-
4 Ways to Improve your Sales Approaches with Business Intelligence
Read moreBusiness intelligence platforms are used to collect and analyze data with charts, metrics, and graphs to ultimately determine what...
-
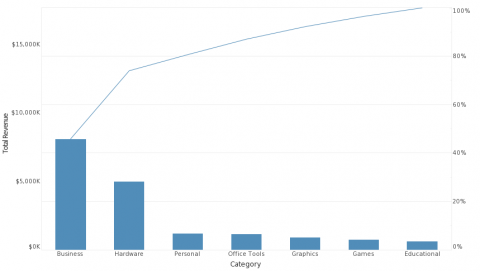
Reading Proportionality Clusters with a Pareto Analysis Chart
Read moreIn a Mashup post last year, we discussed how using a waterfall chart instead of a pie chart can...
