-
Back to the Basics: Adding Context to Charts With Text KPI Metrics
Read moreData visualization has been quite the hot topic in the past several years, and for good reason. Presenting aggregate...
December 15, 20170 -
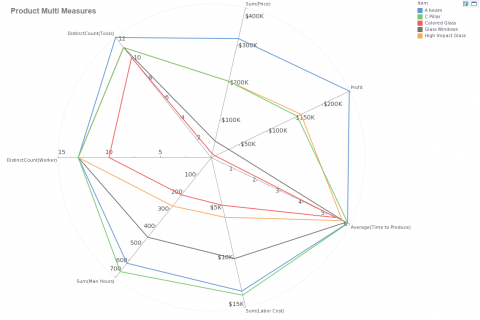
Plotting Many Variables with a Radar Chart
Read moreThe mashup post on dual axis charts showed how an extra axis is useful for compare two metrics of...
-
Top 10 Reasons to Select InetSoft as Your Big Data Analytics Software and BI Dashboarding Vendor
Read moreWondering what sets InetSoft apart from other big data analytics tools and dashboarding vendors? We’ve put together a list...
-
Laying out a dashboard for mobile devices
Read moreWith InetSoft you can create customized views of your dashboards for mobile devices! Find out how here https://www.youtube.com/watch?v=yzUjiPUBYB0
-
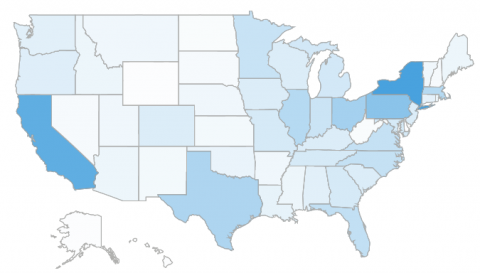
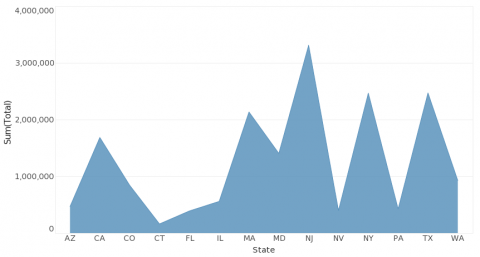
Visualizing Data in a Map
Read moreWhile aesthetics are not the most important element of dashboard design, it is good to try and vary the...
